Rainfall Outlook & An Update On The Tropics
The jet stream is weakest during this next two week stretch. Let's take a look!
Welcome to the Weather Intelligence Report. I would like to discuss the jet stream to begin this updated report that is going out to all levels of customers.
The Jet Stream:
Jet Streams are concentrated areas of high wind speeds that are located near the top of the troposphere. The troposphere is the layer of the atmosphere from the air we breathe up to nearly 50,000 feet up in the summer, and closer to 30,000 feet above us during the winter. Nearly 100% of all weather we experience here on earth is created and happens within this lowest layer of the atmosphere. The stratosphere is the next layer up and that is a very stable layer, almost entirely cloudy free. You can see the top of the troposphere when you see the anvil of the thunderstorm. The thunderstorm will build up and once that cumulonimbus cloud reaches the stratosphere, it spreads out into the anvil.
It was likely during World War 2 when fighter jets were flying high up in the higher levels of the troposphere when they encountered the high head winds and tailwinds of the jet stream. Since they were fighter “jets” the name jet stream was coined.
The jet stream is caused by temperature contrast. During the winter months, the temperature contrast is greatest. It may be -50 degrees in Canada and 90 degrees in northern Mexico. During the summer it may be 70 degrees in central Canada and 110 degrees in the desert southwest. The 140°F contrast in the winter is much stronger than the 40°F summer gradient. The jet stream, as a result, is much stronger and much farther south during the winter. The jet stream reaches it’s weakest point during the first week of August, and is usually at it’s peak strength in near the beginning of February.
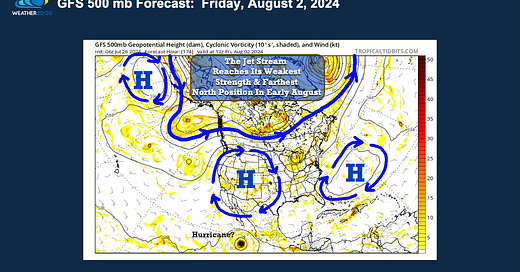
Okay, so I am getting pretty scientific, so let’s take a look at the upper level wind flow, around 18,000 feet up, valid next Friday:
The jet stream is way up north and the flow is being dominated by three upper level highs, called anticyclones. These are heat wave creating machines. Also, notice the potential hurricane forming off the west coast of Mexico.
Let me discuss in today’s video:
Tropical Update:
Weather 20/20 has made the most accurate prediction for seasonal outlooks two years in a row, and we expect to make it three in a row this year. We are continuing to predict 14-19 named storms, as this prediction chart shows below, as issued on March 3, 2024:
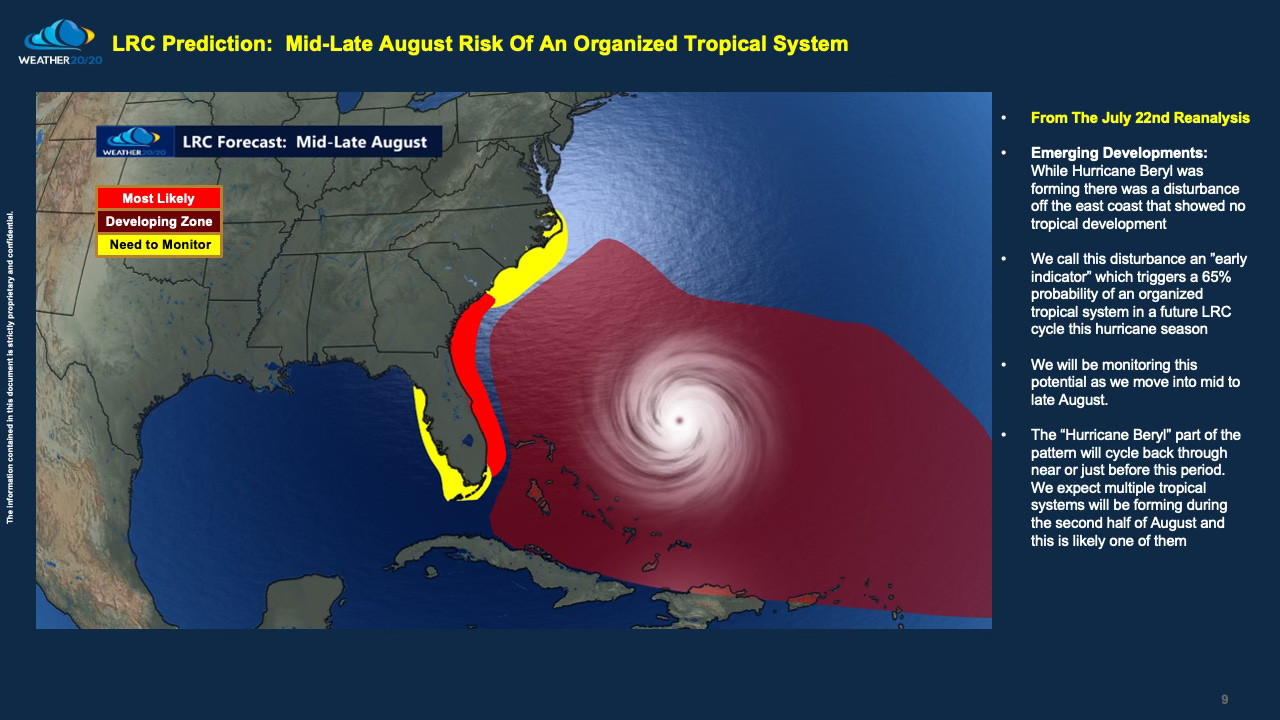
There have been 3 named storms thus far which is right on average for this time of the year. Read the updated predictions below, and watch the video for the explanation. It is about to get active in two to three weeks:
I hope everyone is doing well. I had some serious medical issues this week, so this is why this report is out late. I will have the next Weather Intelligence Report out for our premium customers next Tuesday.
Have a great weekend,
Gary Lezak


Hi Gary, hope u are on the road to a quick recovery! I am a new subscriber and monitoring the LRC specifically in Central FL for mid-late September. The graphic labeled July 25 Update and has the dates listed 9/22-10/5, could you help me understand this a bit better? Is 9/22 the earliest date when this ongoing cycle will repeat? Is 9/28 a date for predicted tropical activity in the region?
hope you are doing well & recovering