
Severe Weather Risks Impact The Corn Belt A Forecast Made Months Ago!

Welcome to the Weather 20/20 Intelligence Report!
As severe weather risks increase across portions of the Corn Belt this week, the atmospheric pattern driving these threats is not a surprise. Weather 20/20 first identified this segment of the pattern last fall and tracked its return through four recurring cycles, allowing risk areas to be highlighted months before the growing season began.
We begin today's report with a map-to-map analysis showcasing one of the most compelling examples of the Lezak Recurring Cycle (LRC) this year. The comparison demonstrates how large-scale atmospheric features identified last October have returned again as summer approaches. It is this recurring behavior that allowed us to highlight an elevated severe weather risk window months in advance.
Take a look at what has been happening, what is happening, and how it compares to the first cycle of this year’s LRC. Stare at the maps for a few minutes and the LRC will come into focus.
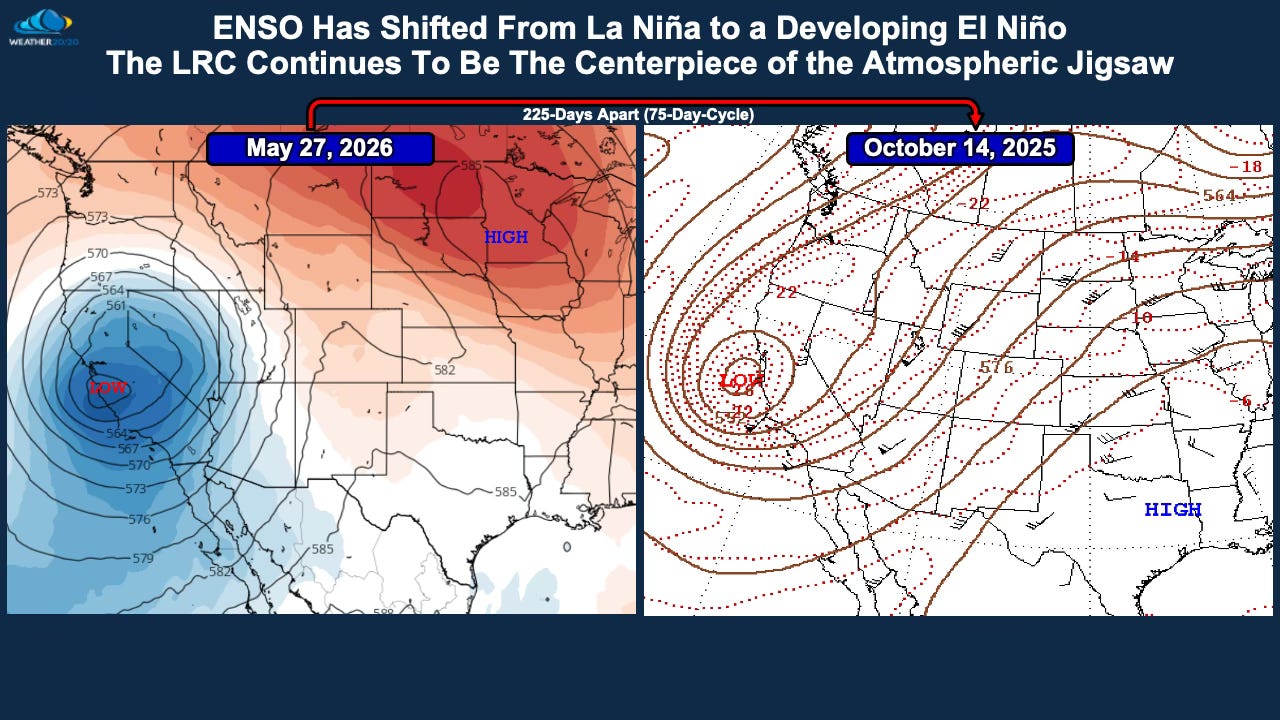
The first slide above shows the weather pattern from May 27, 2026, when a storm intensified near San Francisco, California. This feature is highlighted on the left side of the chart. Now compare it to October 14, 2025, during the first cycle of this year’s LRC, approximately 225 days earlier.
When that storm first developed over California last October, Weather 20/20 identified it as a significant segment of the pattern and projected that it would return in future cycles. It did exactly that during the Christmas to New Year’s period, and then returned once again in late May.
That represents an atmospheric pattern that was identified and tracked nearly eight months before its latest return.
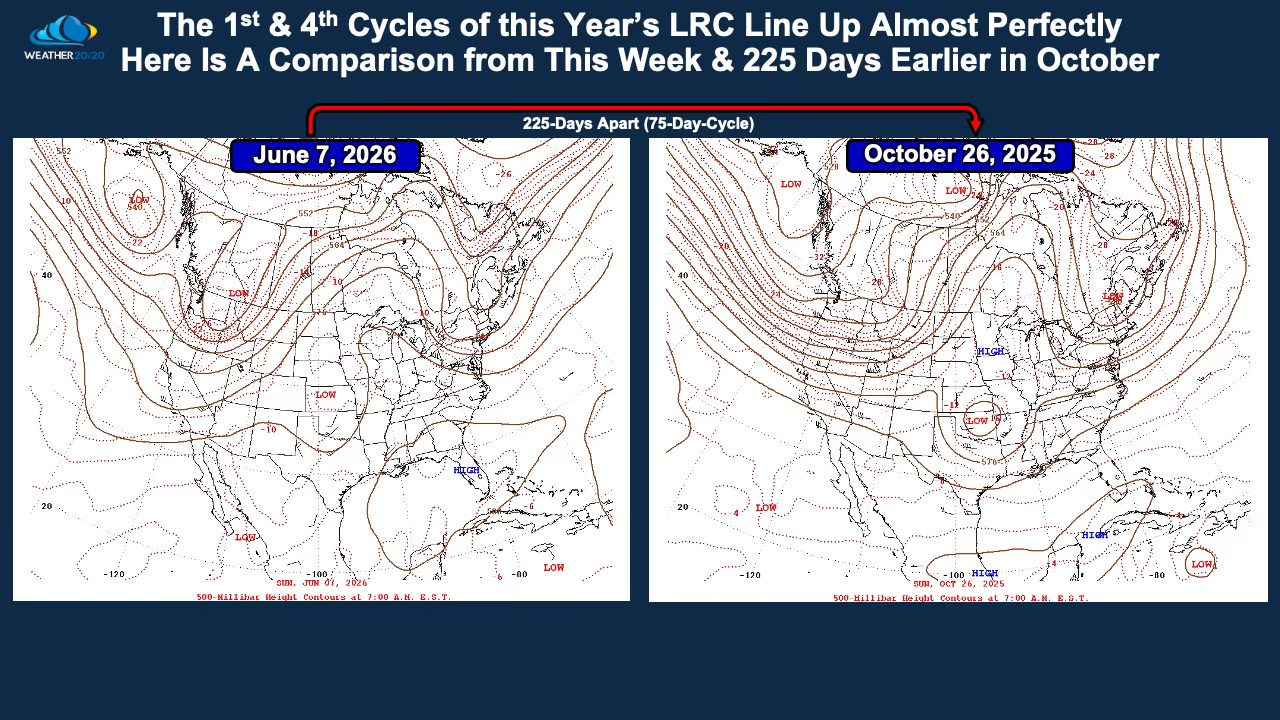
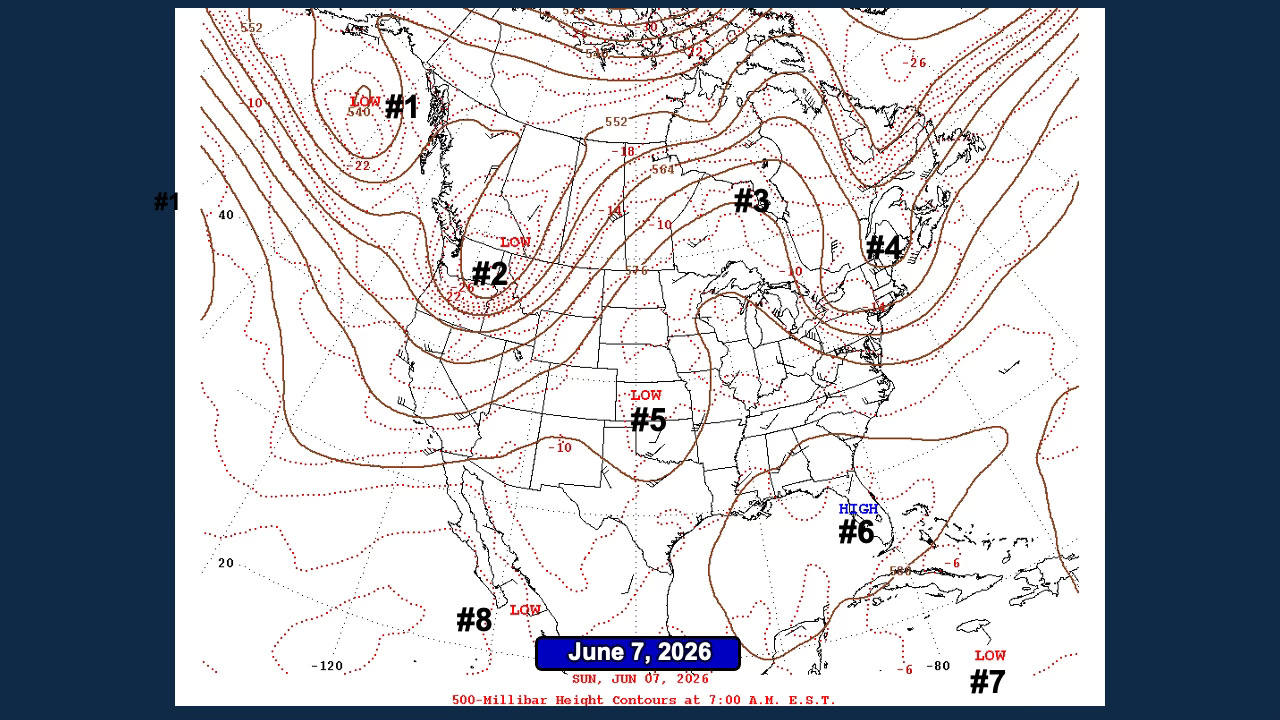
Now let’s move to what has happened this week. The comparison below may require a few moments of careful examination. We are comparing October 26, 2025, in Cycle 1 with June 7, 2026, in Cycle 4 of this year’s LRC.
Look beyond any single storm system. Focus on the larger-scale arrangement of ridges, troughs, and upper-level lows across North America. Notice the recurring trough over the West, the ridge centered over the Plains and Upper Midwest, and the trough positioned over the East.
This is not an after-the-fact analog. This pattern was tracked through Cycles 1, 2, 3, and now Cycle 4 as it evolved throughout the year. The forecast evolved as the cycle length breathed between roughly 71 and 83 days.
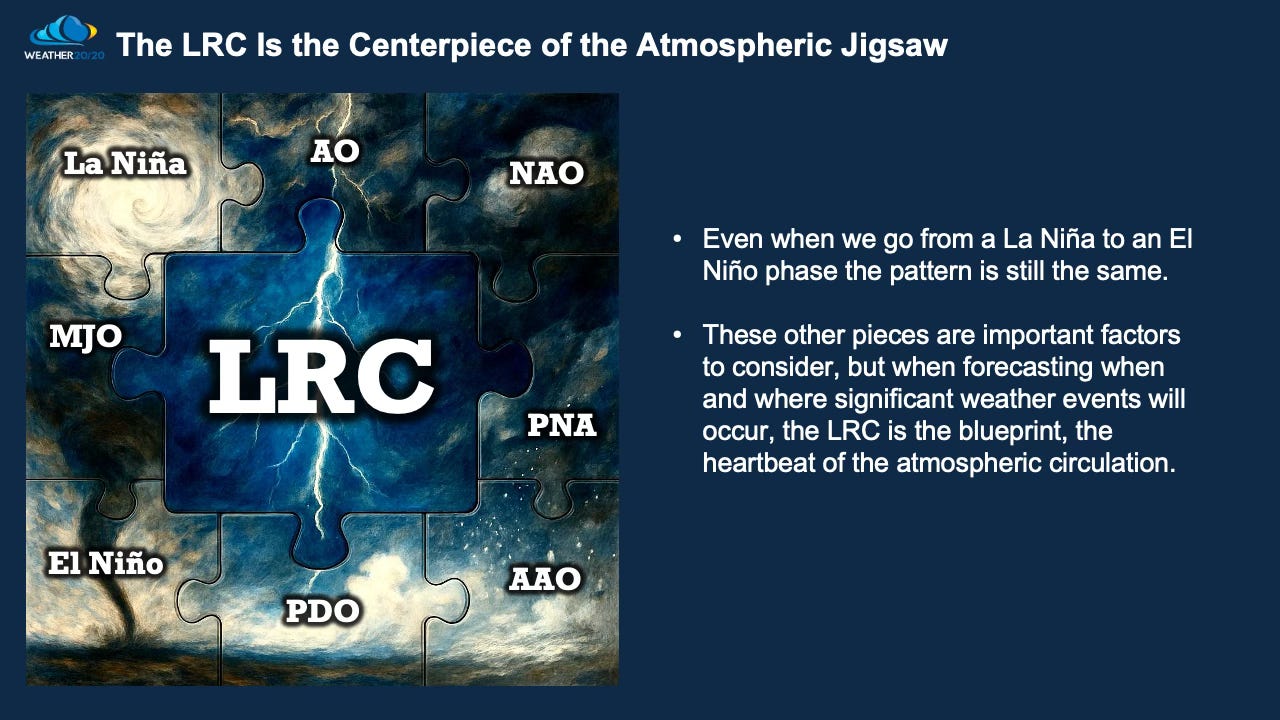
Now that I have established that this is not just a day here or there, but rather the entire weather pattern cycling and returning, and that the pattern we are experiencing right now is remarkably similar to what we saw back in October in what has turned out to be roughly an 11-week cycle, I want to focus on a point we have been making for decades.
The pattern is still similar despite an ongoing shift in the El Niño Southern Oscillation (ENSO).
Back in the fall, a weak La Niña influence was in place. Since then, the Pacific Ocean has continued to evolve, and we are now seeing the early stages of a developing El Niño that is expected to have a greater influence in the months ahead.
Yet despite that transition, the recurring atmospheric pattern has continued to show itself. The ridges, troughs, storm tracks, and risk areas have continued to return, even as the background state of the Pacific Ocean has been changing.
We can see this phase shift taking place on this week’s update of the developing El Niño:
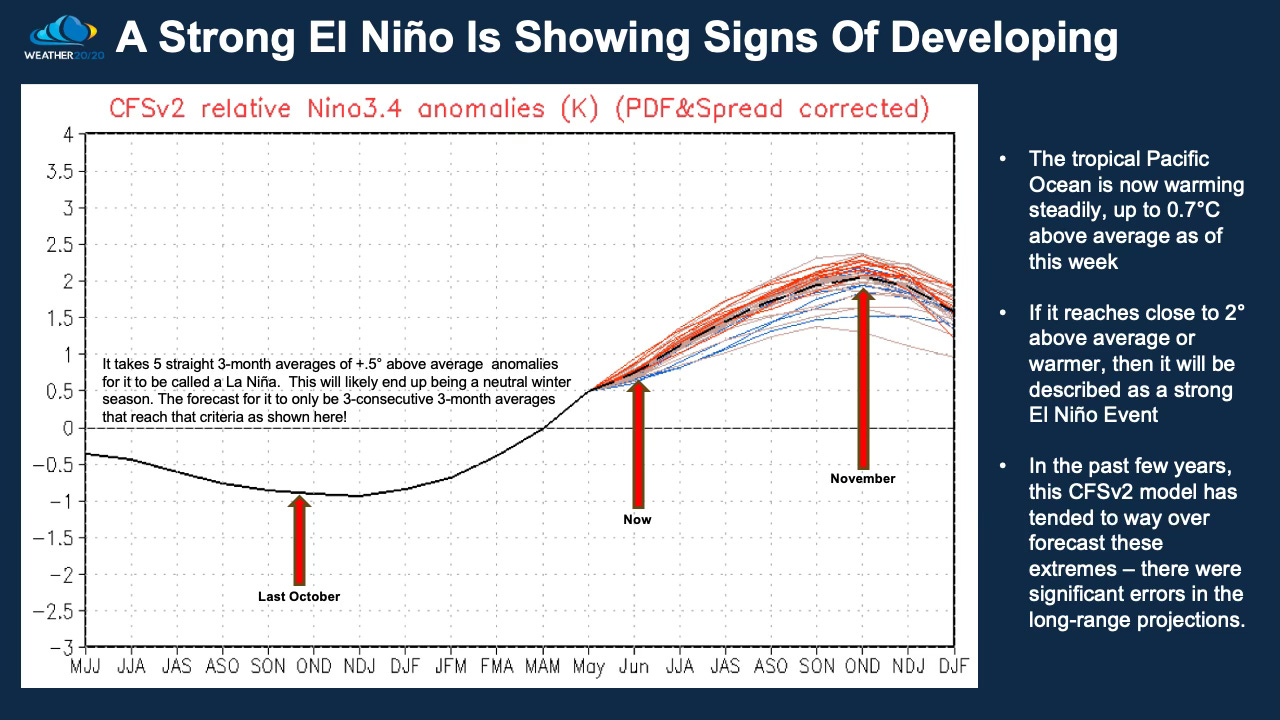
There is a lot of hype surrounding the developing El Niño, and that “hype” is likely to increase as fall and winter approach. Yes, there will be impacts from the warmer tropical Pacific Ocean, and I will continue to argue and showcase that there is something even bigger going on.
The way the LRC sets up next fall will help us identify the most likely impacts from El Niño, and we will meticulously analyze those relationships at the appropriate time in October and November.
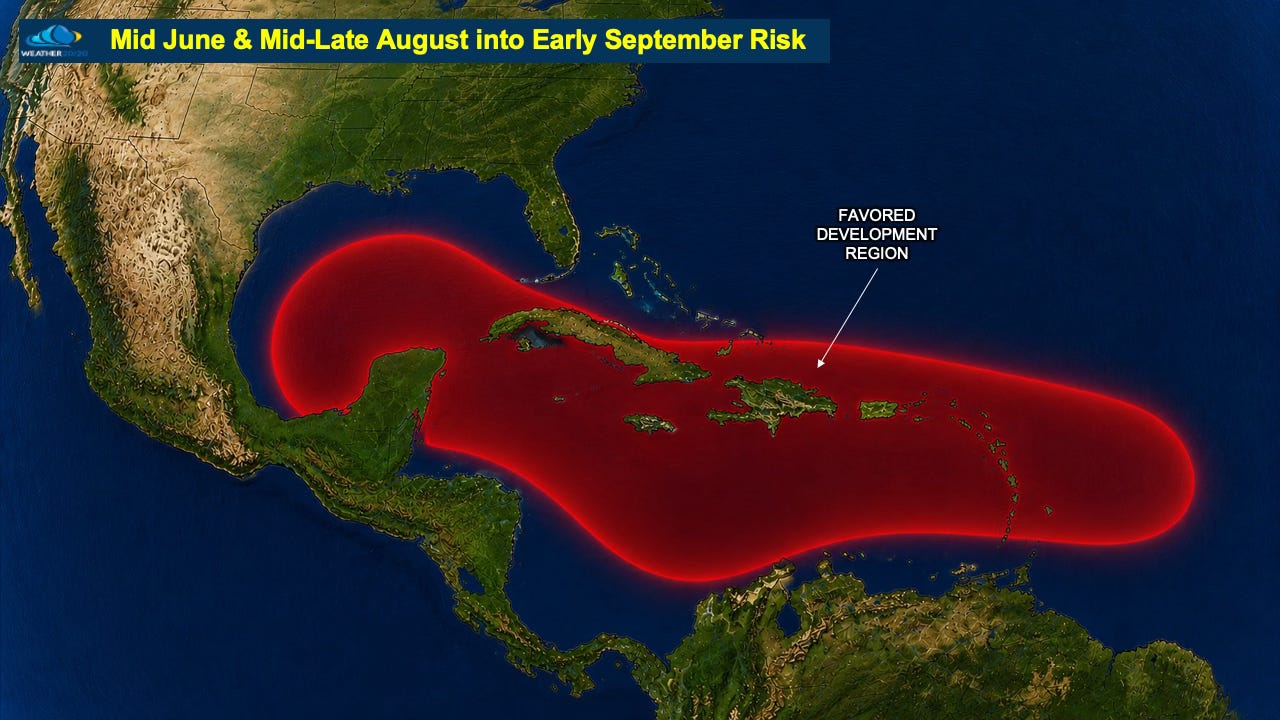
One of our tropical storm and hurricane predictions is shown below. We are in this part of the pattern right now, and it is due to cycle back through in roughly 11 weeks, give or take a few days, or sometime between August 20 and September 10, which coincides with the peak of hurricane season.
Major Hurricane Melissa formed in this segment of the LRC, so this period has our attention as we continue to monitor the evolution of the tropical season.
While Hurricane Melissa was forming, we were also tracking a severe weather segment of the pattern that produced tornadoes last October. That same segment returned in each of the previous three cycles and produced tornadoes again. Now it is producing tornadoes once more this week.
By January, the evidence suggested a cycle length closer to 10 weeks, or about 73 days. As additional cycles unfolded, it became clear that the atmosphere was breathing within a wider range, at times stretching beyond 80 days before settling back toward the mid-70s. The exact timing shifted slightly, but the underlying pattern remained remarkably consistent.
This is one of the most important lessons from this year’s LRC. The forecast evolved as we refined the timing, but the pattern itself did not change. The same severe weather setups identified last fall continued to return through the winter, spring, and now early summer, helping us identify periods of elevated tornado risk months in advance. Everything has been right on schedule!
We refined the timing as more observations became available, while the pattern itself remained the same.
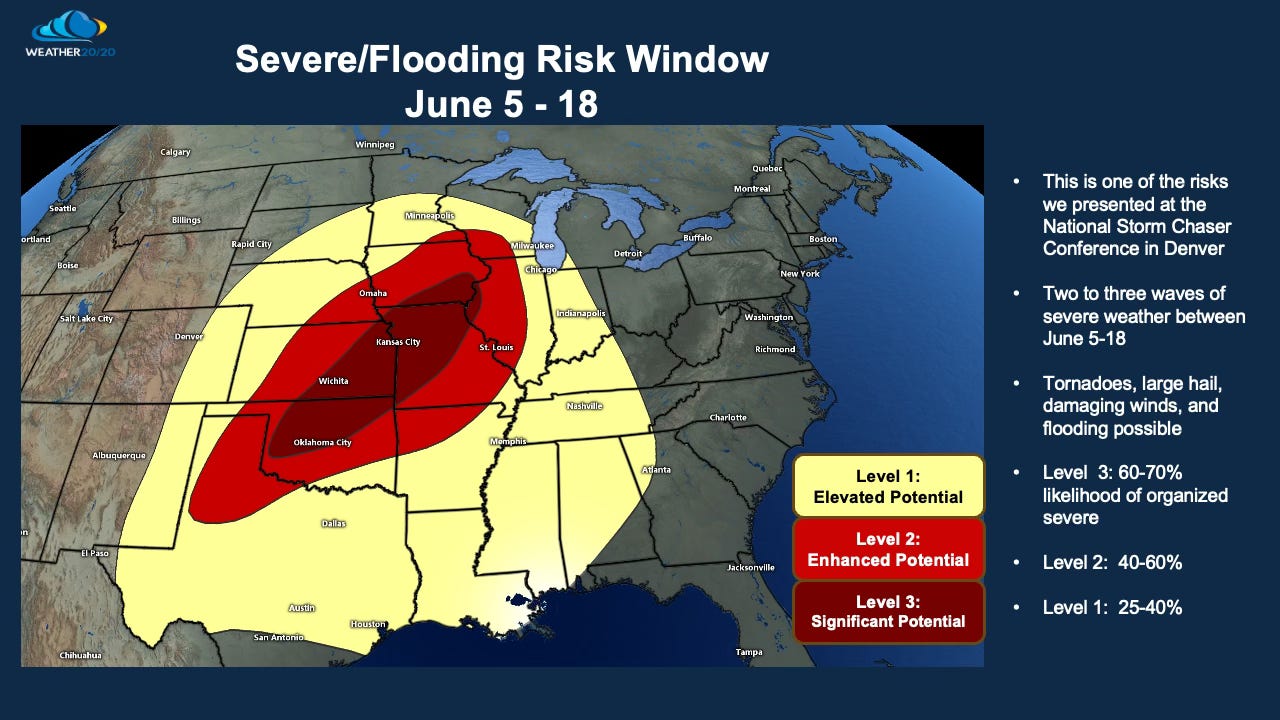
At the National Storm Chaser Summit in Denver in early February, I clearly showcased the segment of the pattern we are in right now, comparing the January cycle to the October cycle at the time. As additional cycles unfolded, we refined the forecast dates as the atmosphere continued to “breathe,” but the outlook itself did not change.
The severe weather risk area highlighted at the conference was based on the expected return of this pattern segment. As the cycle length evolved from an initial estimate near 73 days toward the mid-70s, the dates were adjusted accordingly. The pattern, the forecast logic, and the anticipated risk area remained the same.
Here is a clip from the conference showing this part of the pattern’s forecast return:
4-Month Forecast Verifying Now
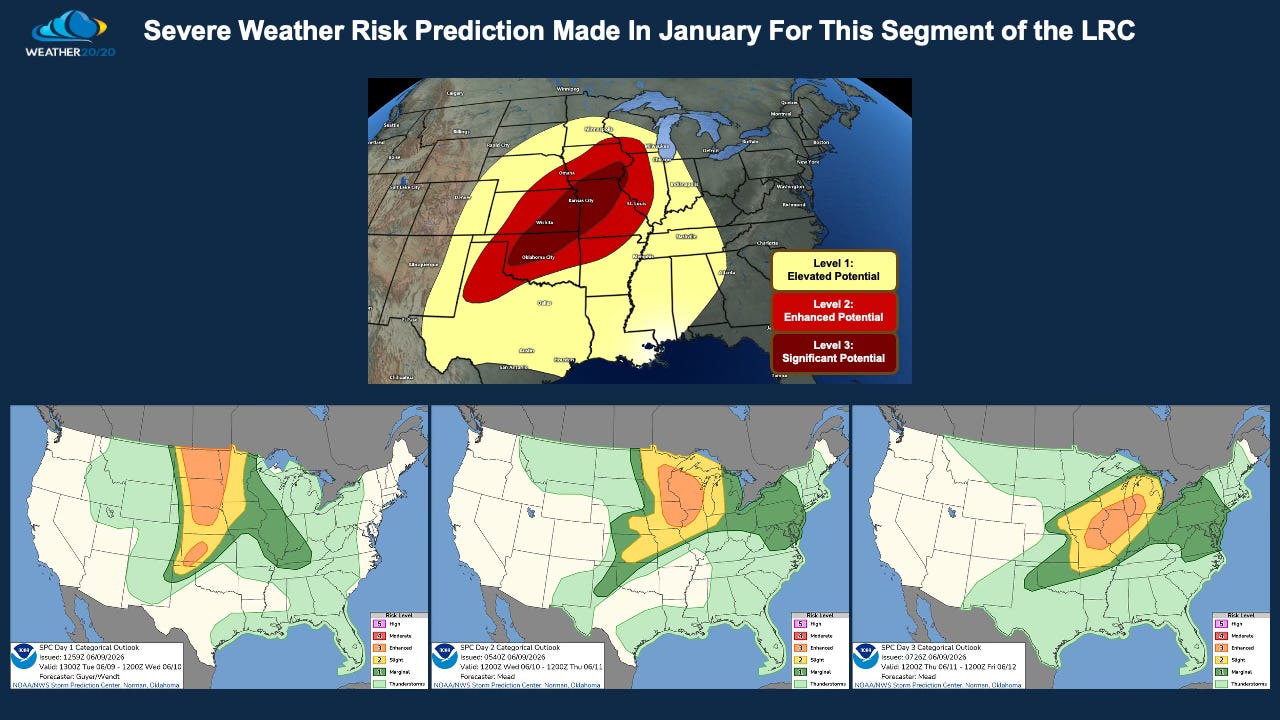
Here are the severe weather risk areas that line up quite closely with the forecast zone I drew in back in January.
Remember, the Weather 20/20 forecast was made four months ago at the National Storm Chaser Summit, and in reality, the forecast traces back nearly eight months to the identification of this pattern segment during the first cycle last October.
The severe weather outlooks for today, Wednesday, and Thursday are short-range forecasts issued just 1, 2, and 3 days in advance. Yet they are aligning remarkably well with the risk zone highlighted months ago based on the expected return of this segment of the LRC.
This is not a forecast based on June climatology. The risk area was identified because the atmospheric pattern responsible for severe weather was expected to return, and now that pattern is cycling through once again.
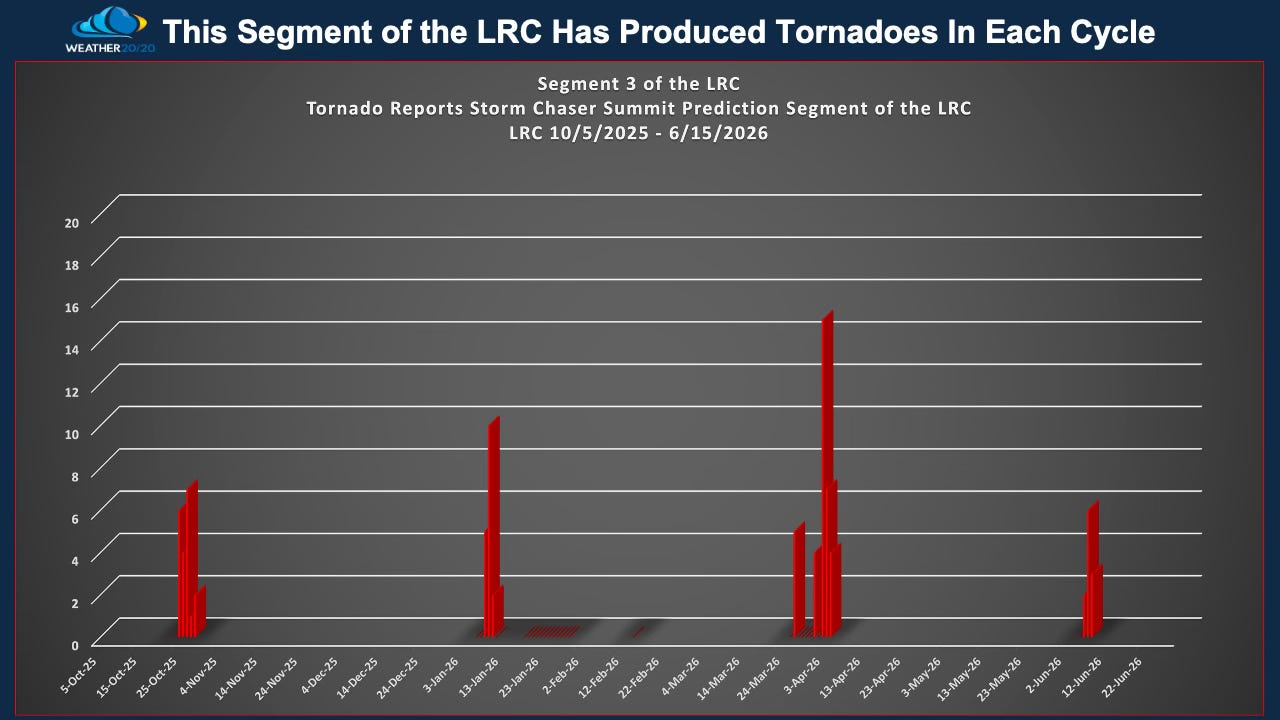
The chart above shows how tornadoes have occurred during this segment of the pattern in every cycle of this year’s LRC. This particular pattern segment is now four-for-four, or 100%, in producing tornadoes as it has cycled through the atmosphere.
Of course, each cycle is unique, and the exact locations, intensity, and number of tornadoes will vary. However, the consistency of severe weather occurring during this recurring segment of the pattern is difficult to ignore.
Four cycles. Four returns. Four tornado-producing events.
Before we move on to the current setup and our long-range rainfall outlooks through the remainder of June and July, here is today’s video where I walk through the map-to-map comparisons, the cycling pattern, the severe weather forecast, and what it all means moving forward.