


The Debut of the Global Predictor
A look at where we are in the LRC right now

Welcome to the Weather 20/20 Intelligence Report! This report is being shared with our premium and basic subscribers as we are announcing the launching of the Global Predictor.

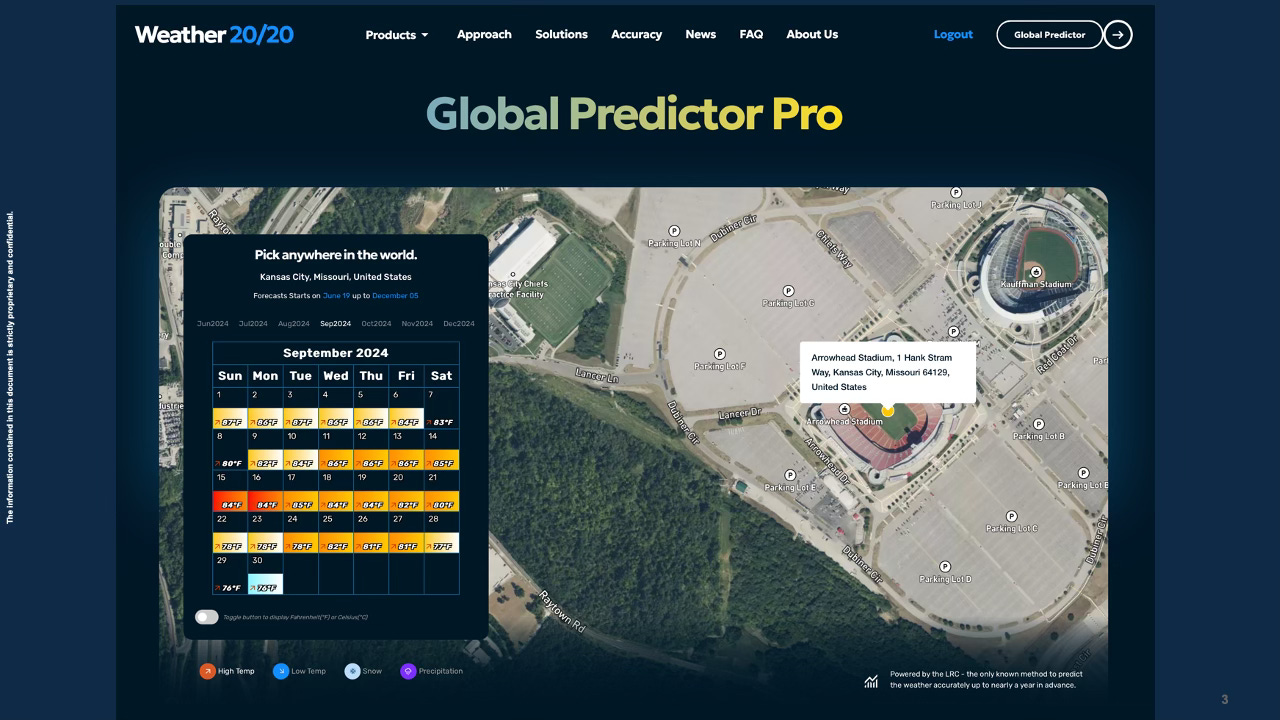
We are soft launching the Global Predictor today. Just go this link: Global Predictor which is in the top left corner of the website to sign up. It is only $5.99/month and I am certain you will love it. Please provide some feedback after you start testing it as we are still tweaking some things. You can get your forecast for anywhere in the world. Just pan around, zoom in, have some fun, and click on your location, like I did here for Paris, France, since the Olympics are there in July.
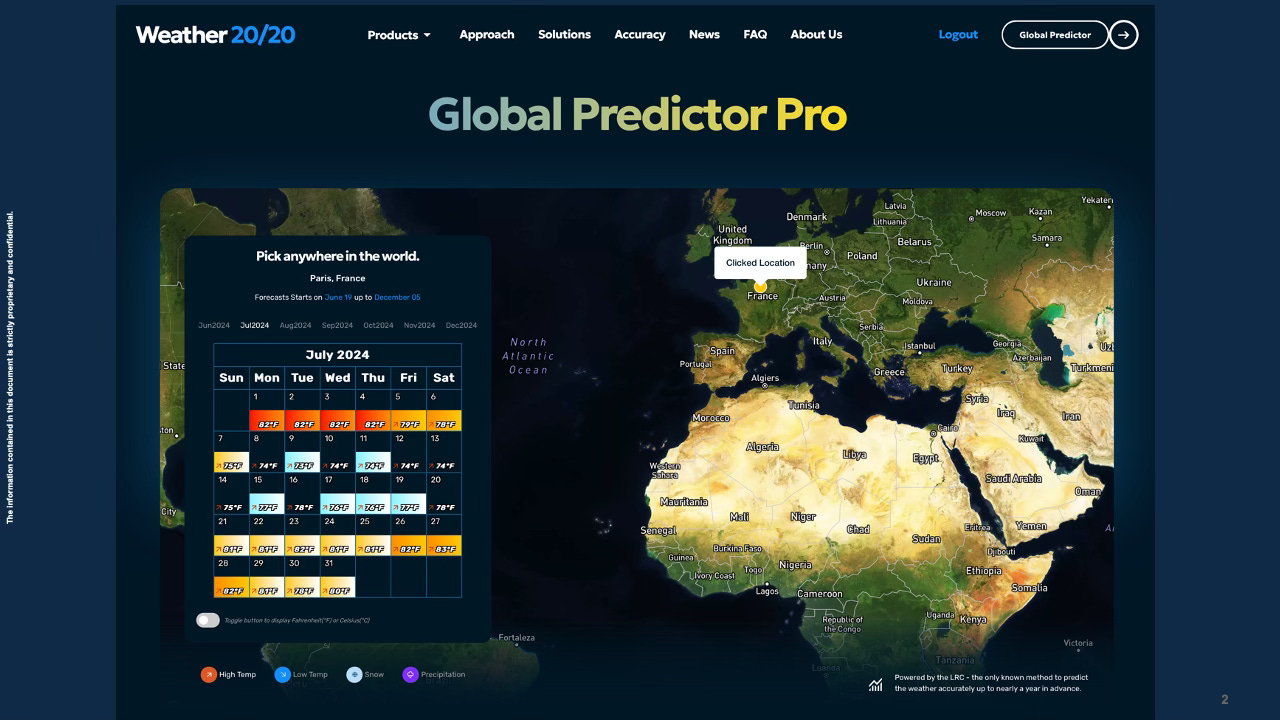
The Global Predictor is powered by the LRC model. Here is today’s video:
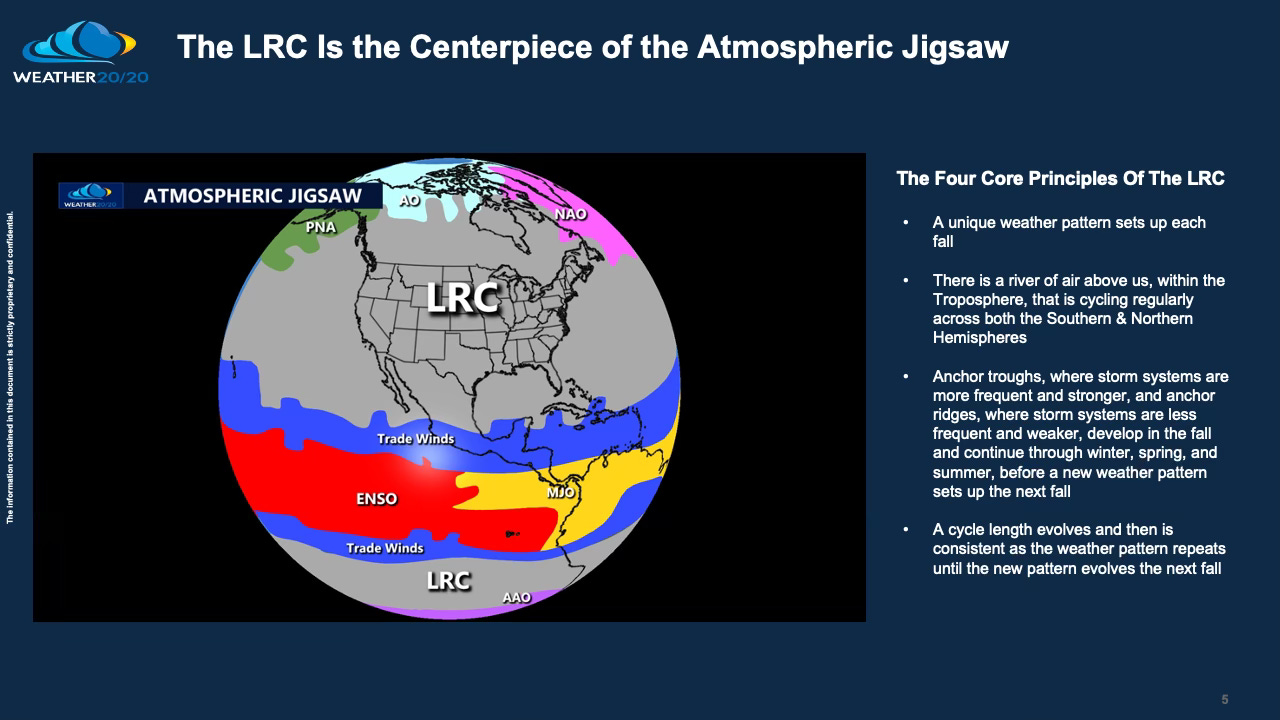
The weather pattern is cycling regularly and there are four core principles of the LRC as you can see on this next slide.
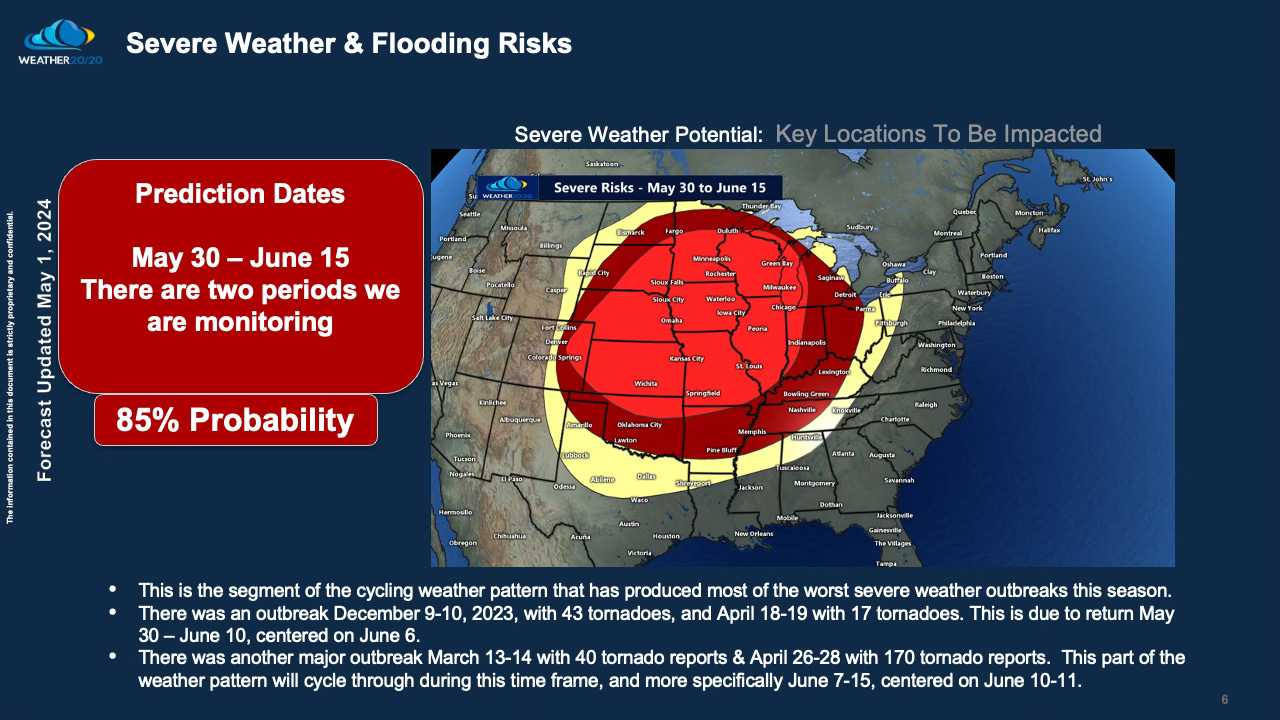
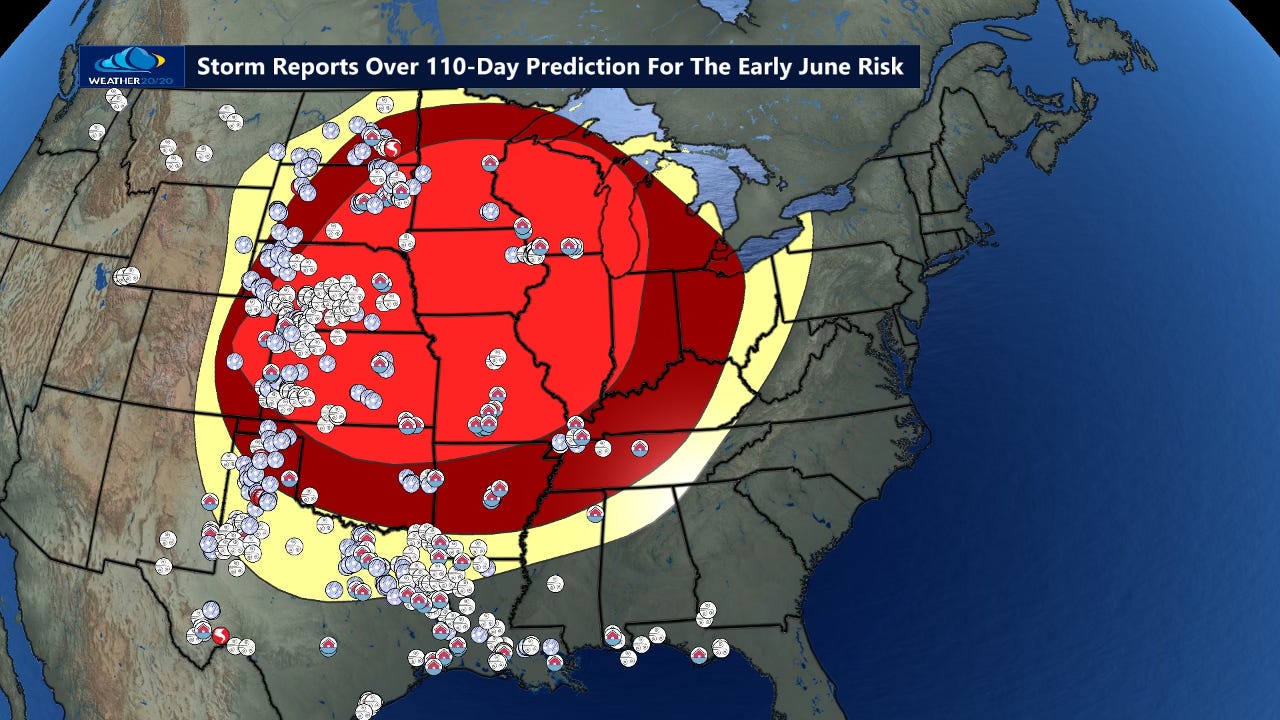
There is a risk of severe weather today, June 4, 2024, and it is right down the middle of our prediction made February 15th, then updated May 1st, shown below:
How are we making these accurate predictions weeks to months ahead of time? The answer presents itself in the understanding of the cycling weather pattern, the LRC. Last week we showed you this example of how the weather pattern is right on schedule, and when analyzing today’s weather pattern for the current risk of severe weather I added in that comparison which is mind blowing. Take a look:
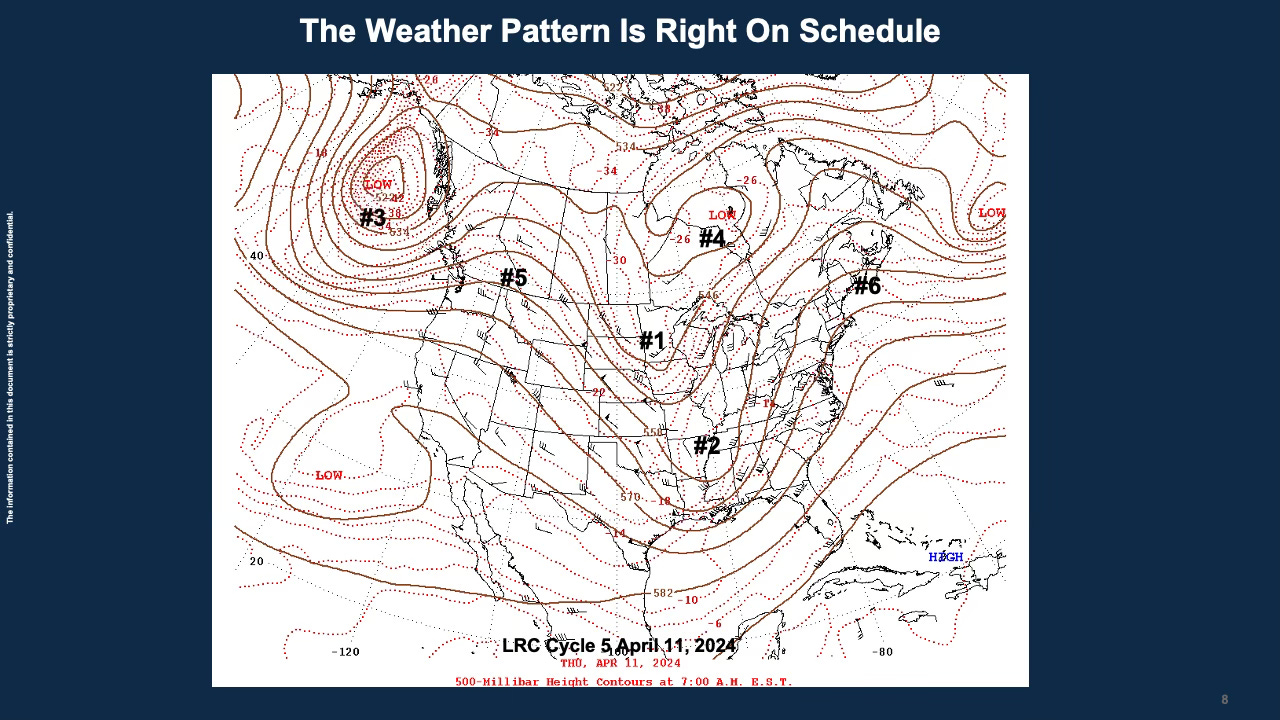
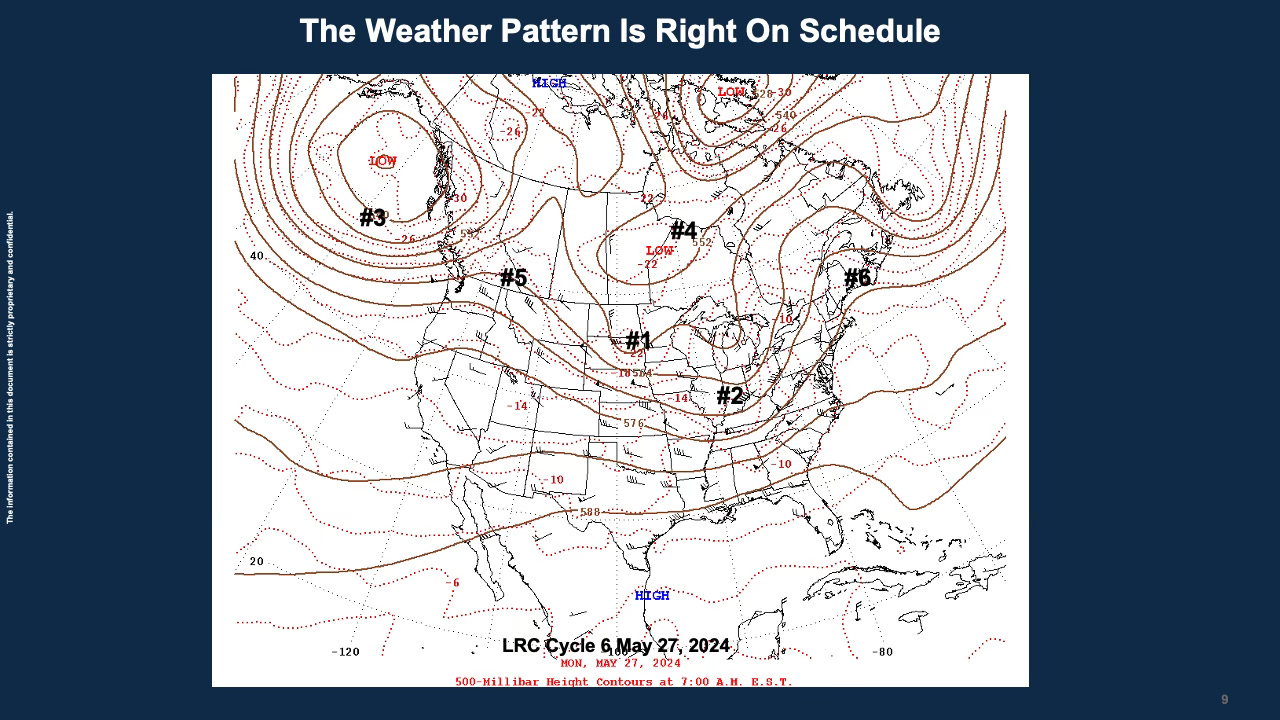
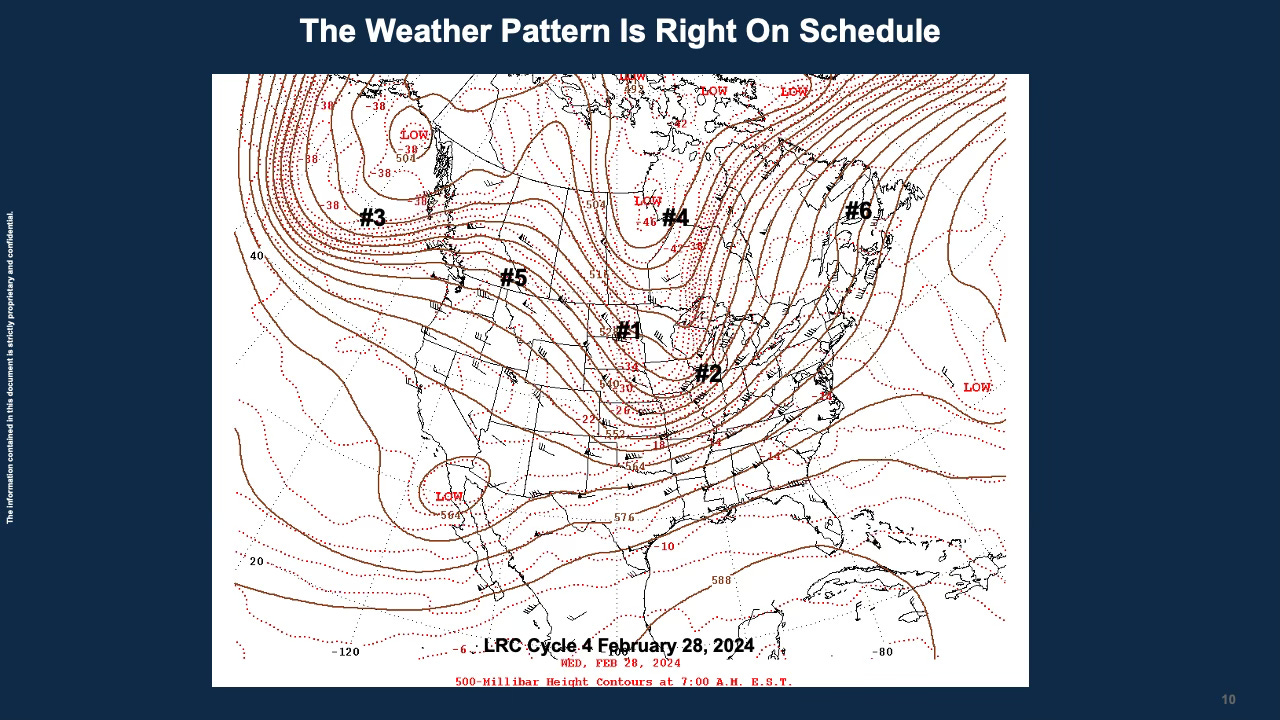
Last week we showed that above comparison of the past three cycles. And, this week we are going to showcase the weather pattern from today. Take a look at feature #1 on the slide below:
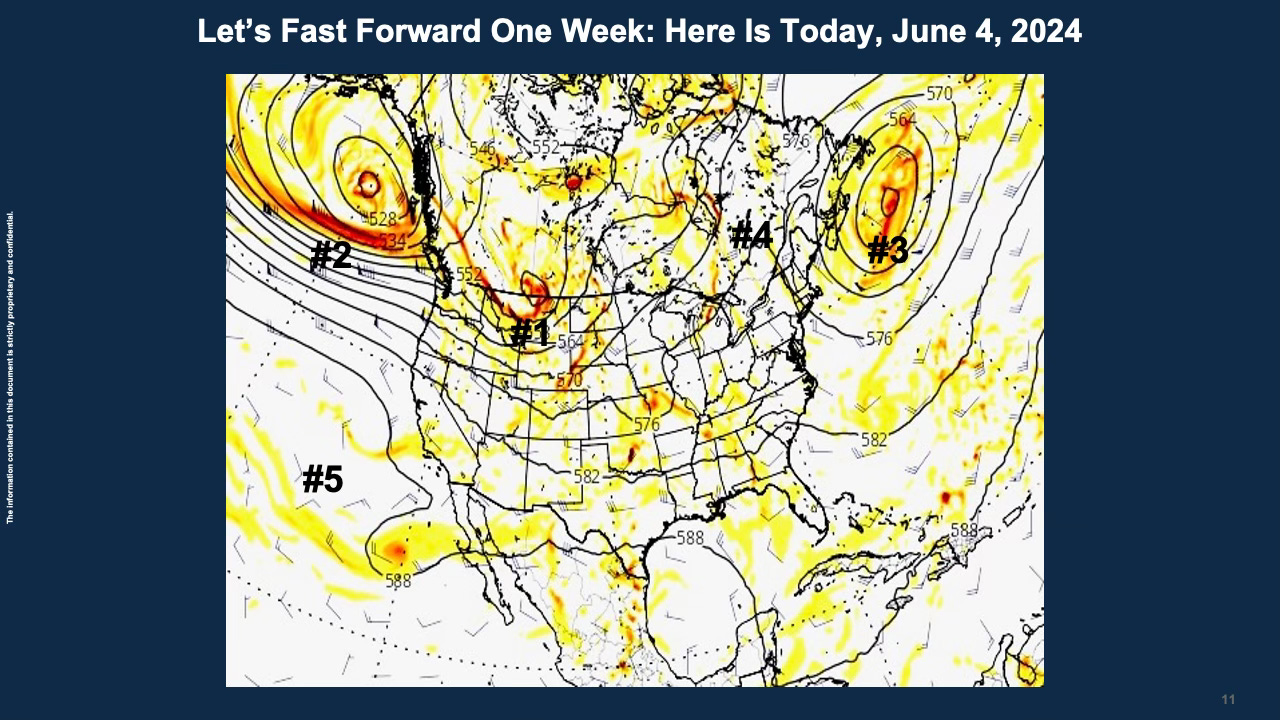
In October, we discussed how this is “The Clipper” part of the LRC. Look at that system near the Canada/Montana border, and now look at this next chart below from 231 days ago in the first cycle of this year’s LRC. You can’t make this up:
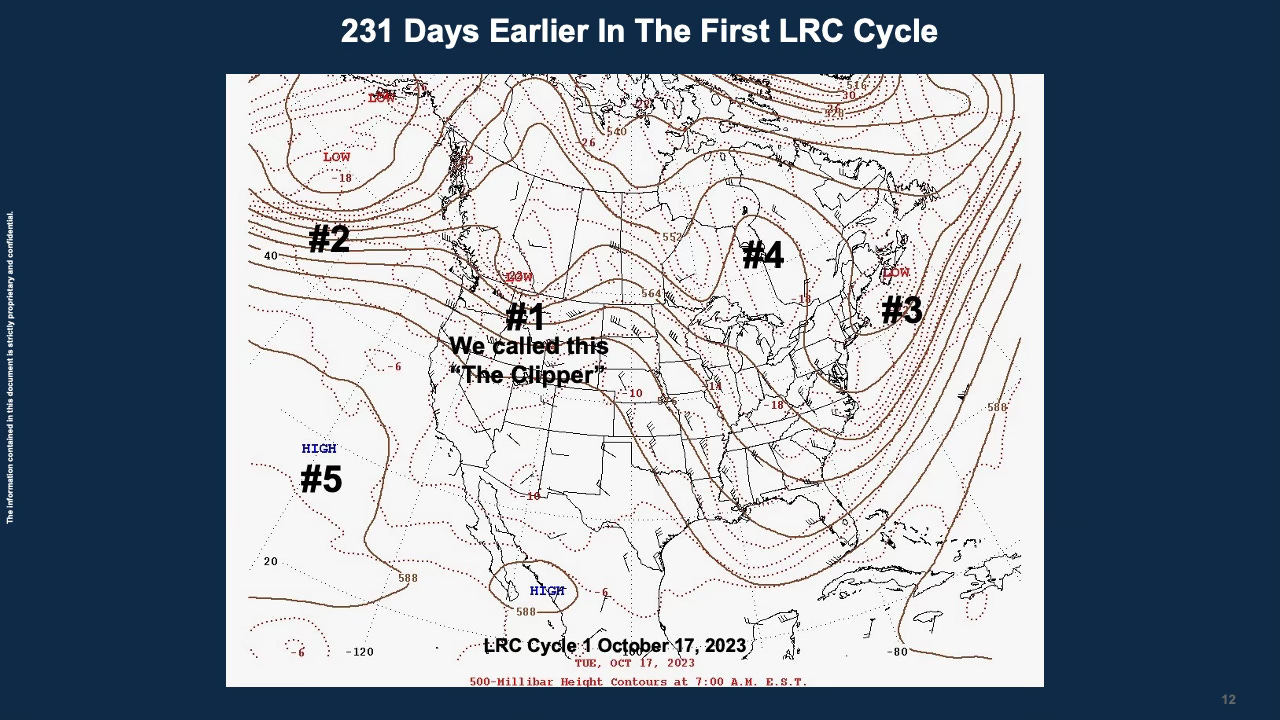
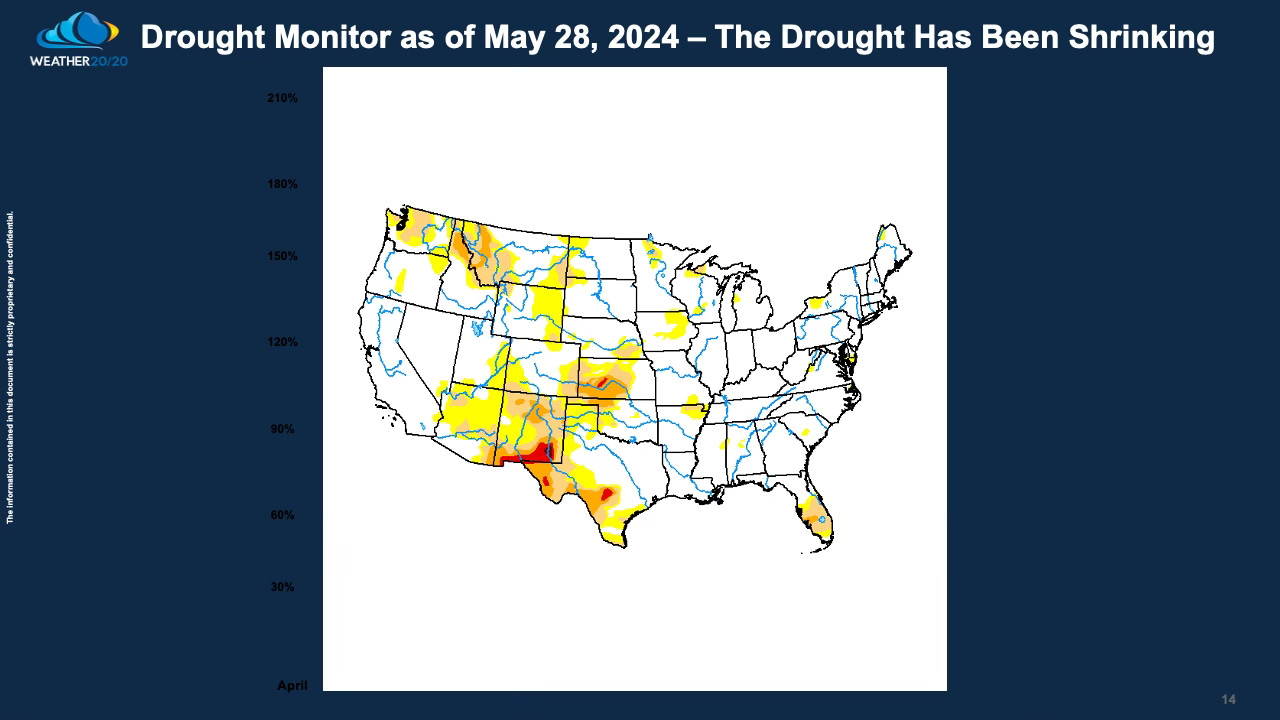
This showcases once again how the weather pattern is cycling and regularly and we are sharing results with accurate predictions to help your team prepare. This year’s weather pattern is unique, and it is a strange weather pattern. Aren’t they all? The drought got wiped out from with this weather pattern we have all been experiencing.
As summer approaches, almost the entire Corn Belt is drought free. There is some dry stress in a few areas, but at least we are starting with really good growing conditions. Look at the drought monitor from last Thursday:
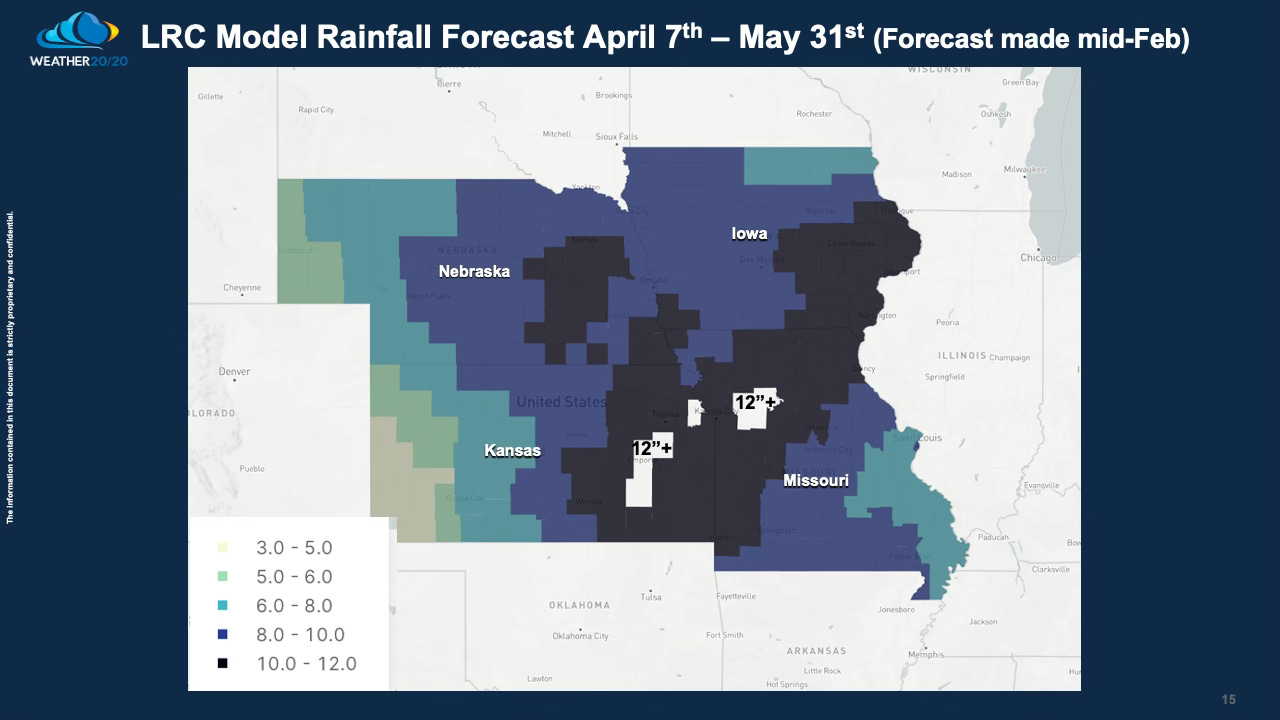
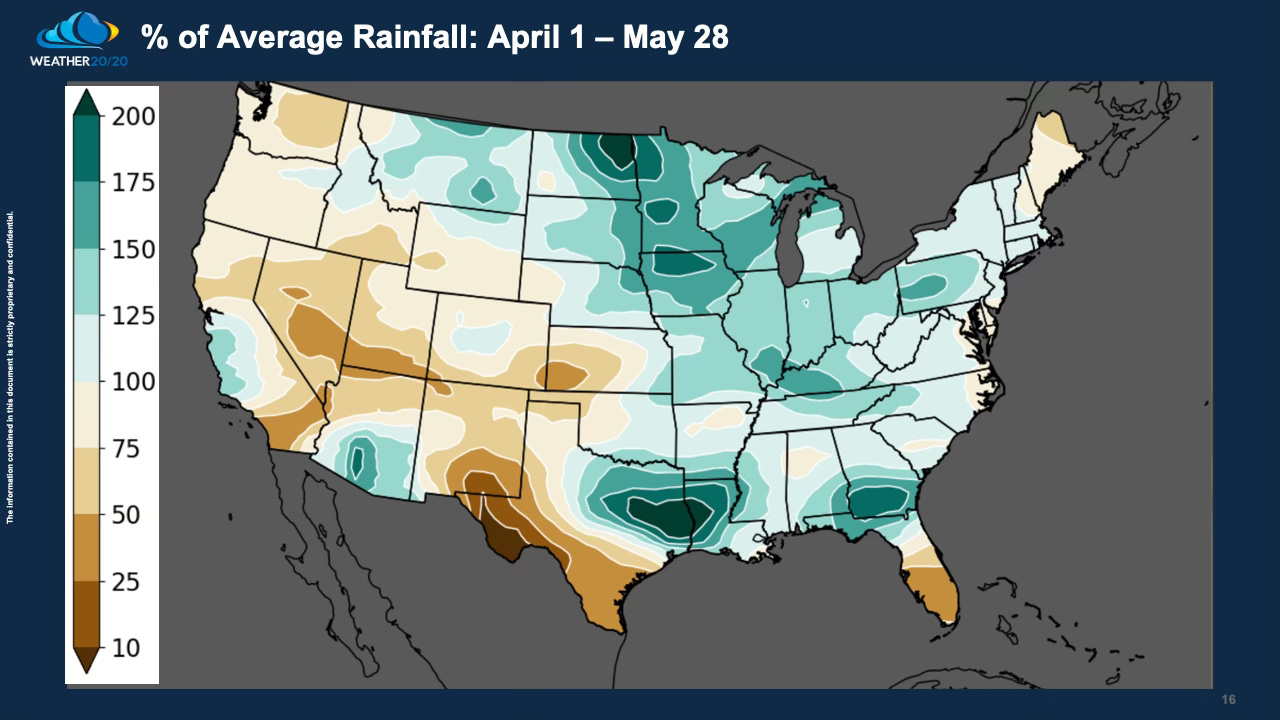
Looking back at our LRC model prediction for the past two months, you can see here that Nebraska, Iowa, Kansas, and Missouri were forecast to have adequate rainfall to begin the planting season, and it verified.
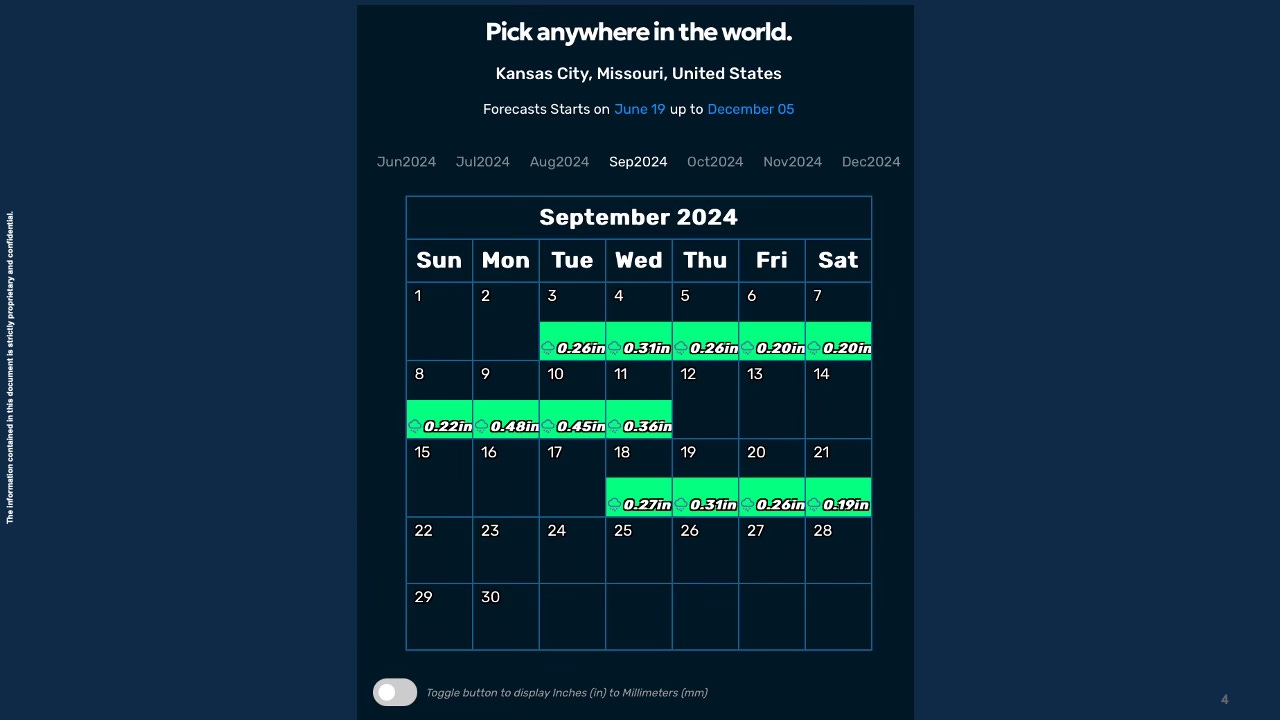
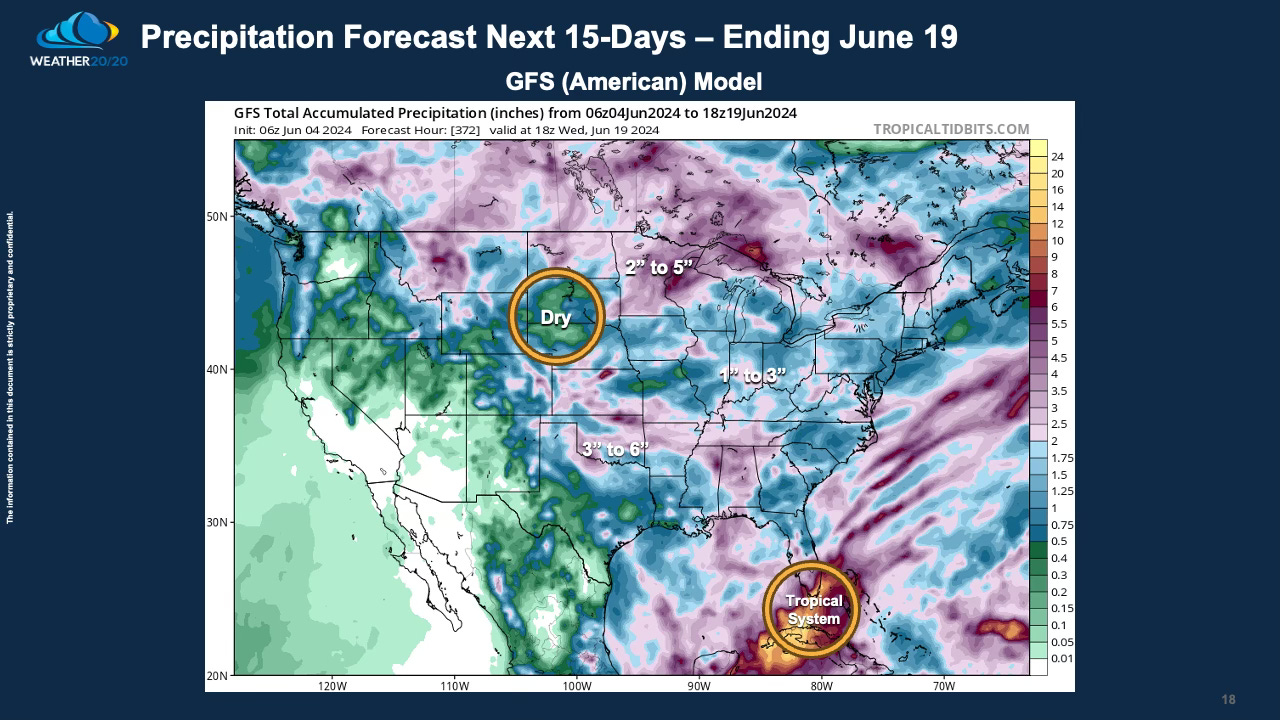
Rainfall Forecast - Next 15 Days
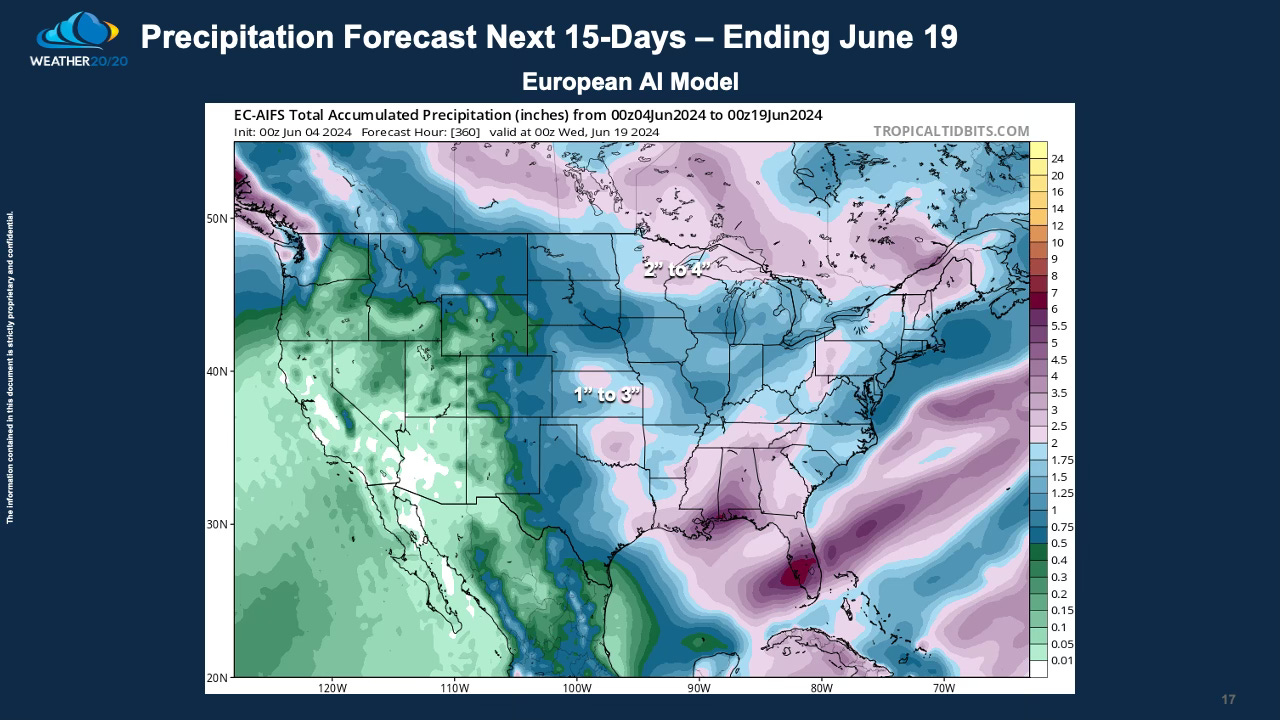
The map above shows the European AI model and the map below shows the GFS (American Model) predictions for the next 15 days. Most areas are again predicted to have 1 to 5 inches of rain, and of course Kansas City is near one of the minimums. We will test that minimum tonight as thunderstorms track across the plains.
These next three maps show the LRC predictions through the end of this year’s LRC, through September 30, 2024
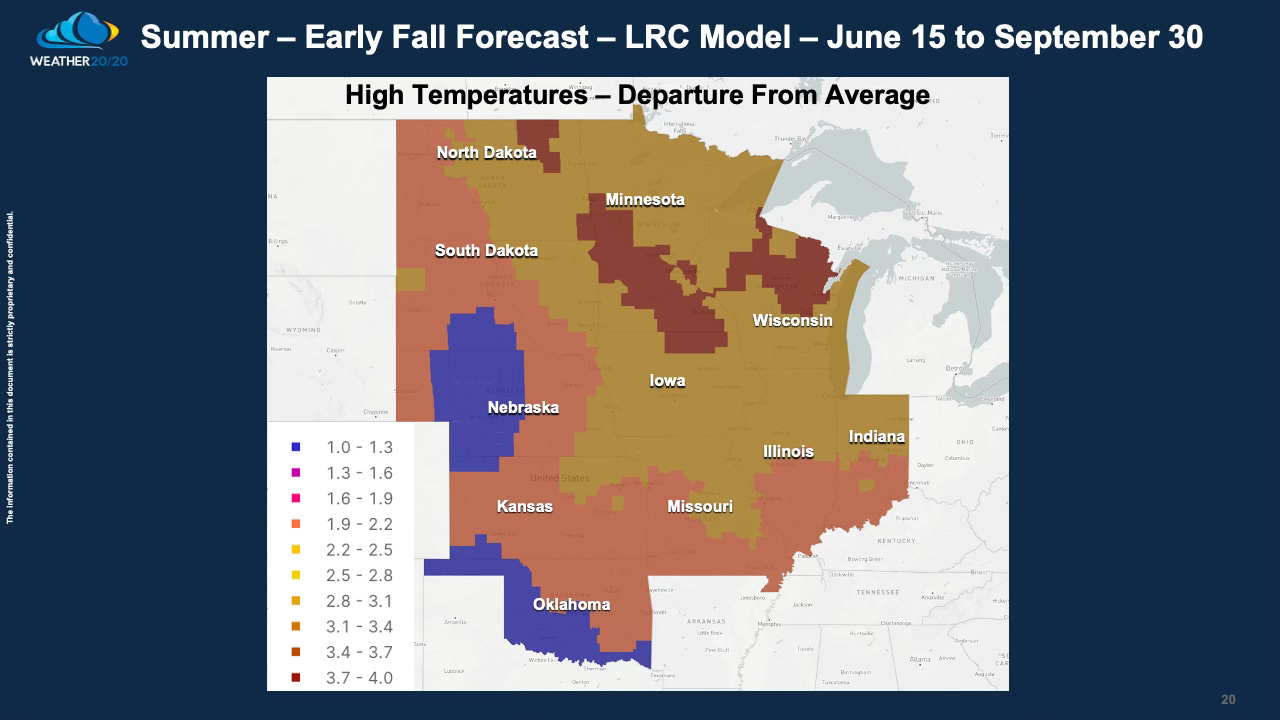
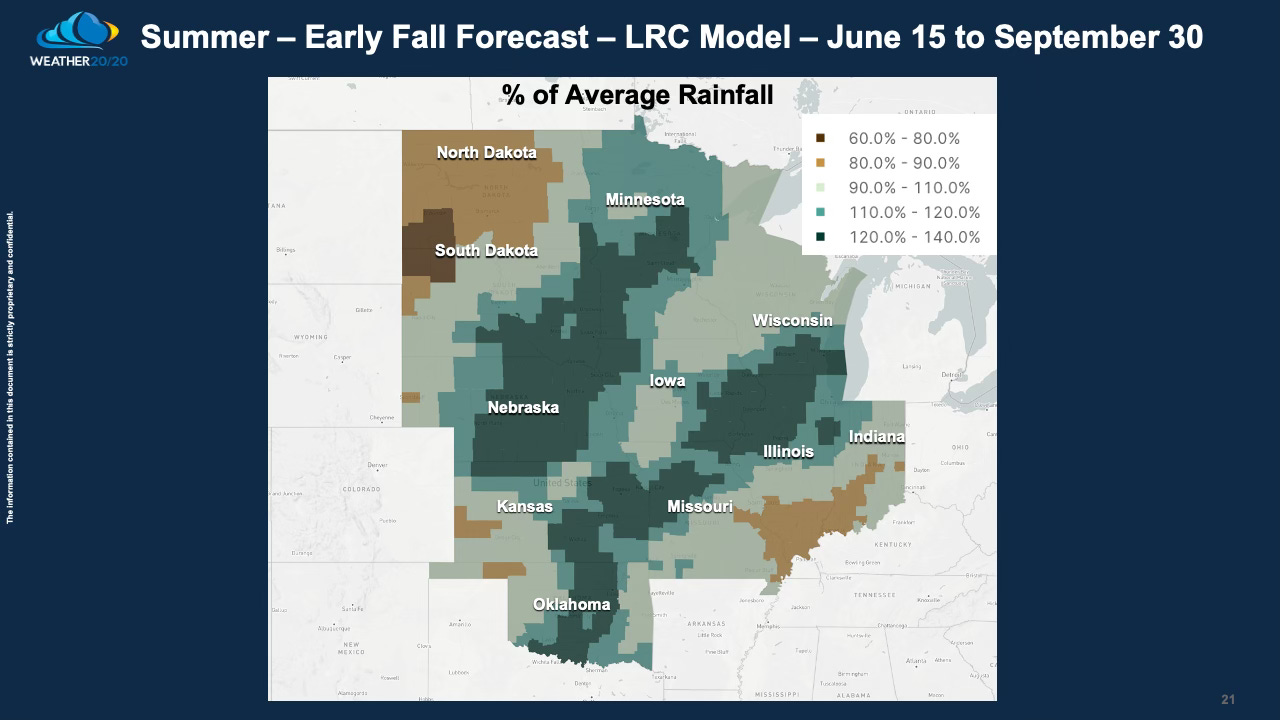

In conclusion, sign up and get the Global Predictor, and if you would like to have the best weather tool known in the field of meteorology today, then contact Bryce Palmer and he will get you access to the maps you see above that you can zoom right into your county and prepare up to a year ahead.
Next week, for our premium customers of this Weather 20/20 Intelligence Report we will dive into the summer heat wave predictions. Have a great rest of the week,
Gary
This is awesome! I have a couple of questions. The Global Predictor FAQs mentions there is a Global Predictor app but I didn’t see it in the App Store or Google Play. Also just curious why the forecast starts 2 weeks out. Would it be possible to have it start as soon as 7 or 10 days out to cover the gap after the traditional forecast ends? Also, one day in the future, it would be awesome if dewpoint was a part of the forecast. I look at that more so than the temperatures in the warmer months. Love this!