Welcome to this special edition of the Weather 20/20 Intelligence Report, available to all our valued readers. A heartfelt thank you to our premium members for your continued support. If you're not yet a premium member, we invite you to elevate your weather intelligence for less than $1 a day—that's $300 per year. We're gearing up to offer invaluable insights generated from our patent-pending LRC model. In just a few weeks, we'll be rolling out forecasts that not only promise accuracy but also extend all the way through to next September. These predictions are as, or more accurate at 100-days out as the traditional GFS (American) and European models are at 10-15 days out.
Can you feel the atmospheric shift? Right around the curtain call of the first week in October, the Northern Hemisphere enters a period of meteorological rebirth. A new, singular weather pattern begins to evolve, unlike any that has come before it. Per the insights of the LRC, a one-of-a-kind weather pattern takes shape each year between early October and mid-November. Let's delve into this year's emerging pattern and contrast it with the striking deviations from what was evolving just one year ago.
Unveiling the New LRC: Weather 20/20 Intelligence Report Explained
Dive into a detailed walkthrough of our latest report to discover what's shaping our weather world right now. I describe most of this in the video, with an in-depth discussion below:
A Very Different Pattern Is Setting Up
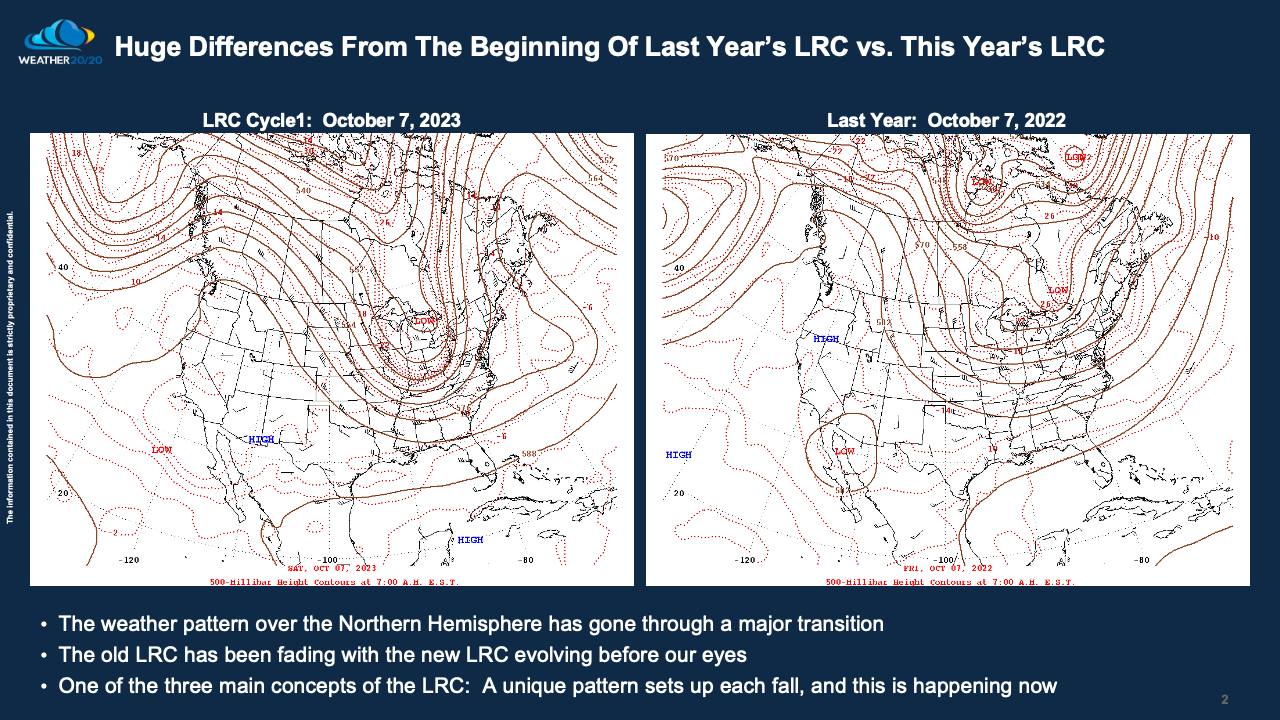
Let’s look closely into the developing weather pattern and compare it to what was happening exactly one year ago. The upcoming few slides present a compelling side-by-side analysis at the 500 mb level. To your left, you'll find the atmospheric conditions for 2023, while the right side reveals what was happening exactly a year ago in 2022.

In today's Weather 20/20 Intelligence Report, we dive deep into the mechanics of the atmosphere by examining the 500 mb flow, situated approximately 18,000 feet above sea level. At this atmospheric height, we're looking at isobaric surfaces—lines of equal atmospheric heights, whereas on surface maps we show isobars. Let's consider the 570 line: this delineates where the atmospheric pressure is precisely 500 mb at an altitude of 5,700 meters. Similarly, the 552 line marks the locus where this 500 mb pressure occurs at 5,200 meters, indicative of lower geopotential heights.
Why focus on the 500 mb level, you ask? Well, it's a prime vantage point for identifying storm systems, as surface friction is essentially negligible here. Moreover, wind vectors are oriented parallel to these isobaric contours, facilitating our understanding of the larger circulatory behavior. Intriguing, isn't it?
But here's a mind-bender for you: the pressure at the top of the atmosphere is virtually zero millibars (mb), while at Earth's surface, it hovers around 1,013.25 mb, which is the average surface pressure corrected to sea level around earth. That places the 500 mb level smack dab in the middle of the atmospheric column, in terms of pressure weight. It's a lot to digest, but understanding these intricacies is paramount for decoding the atmospheric enigmas we encounter
The two charts above show October 12th from just days ago (left) and from one year ago (right). The patterns diverged widely as they should according to the LRC.
By October 13, 2023, just a few days ago, we can see the major difference from this year to a year ago. Now, what does all of this mean? We will identify the differences, and begin predicting the weather for the next year.
What Just Happened!
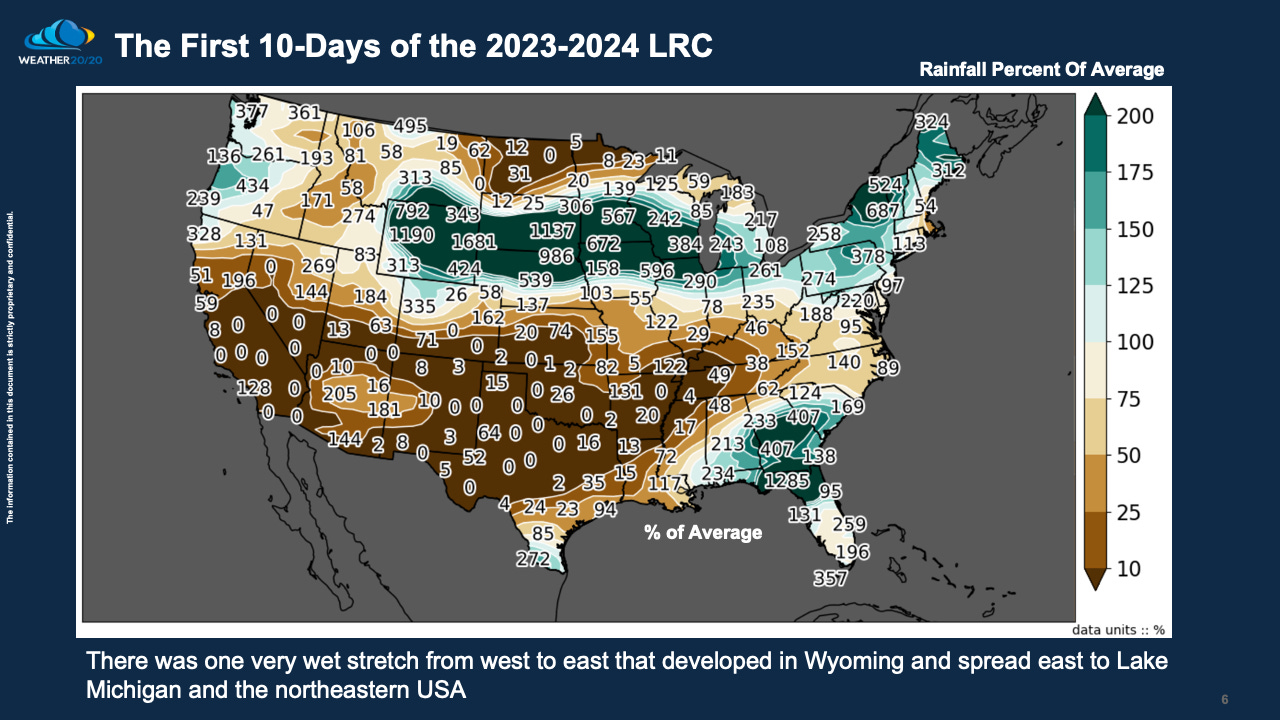
Take a moment to closely examine the next two slides, which highlight the stark contrasts between the weather patterns from the past eleven days to those of a year ago. The first map displays rainfall totals, with percentages of average rainfall denoted by the accompanying numbers. This covers the period from October 7th to October 17th:
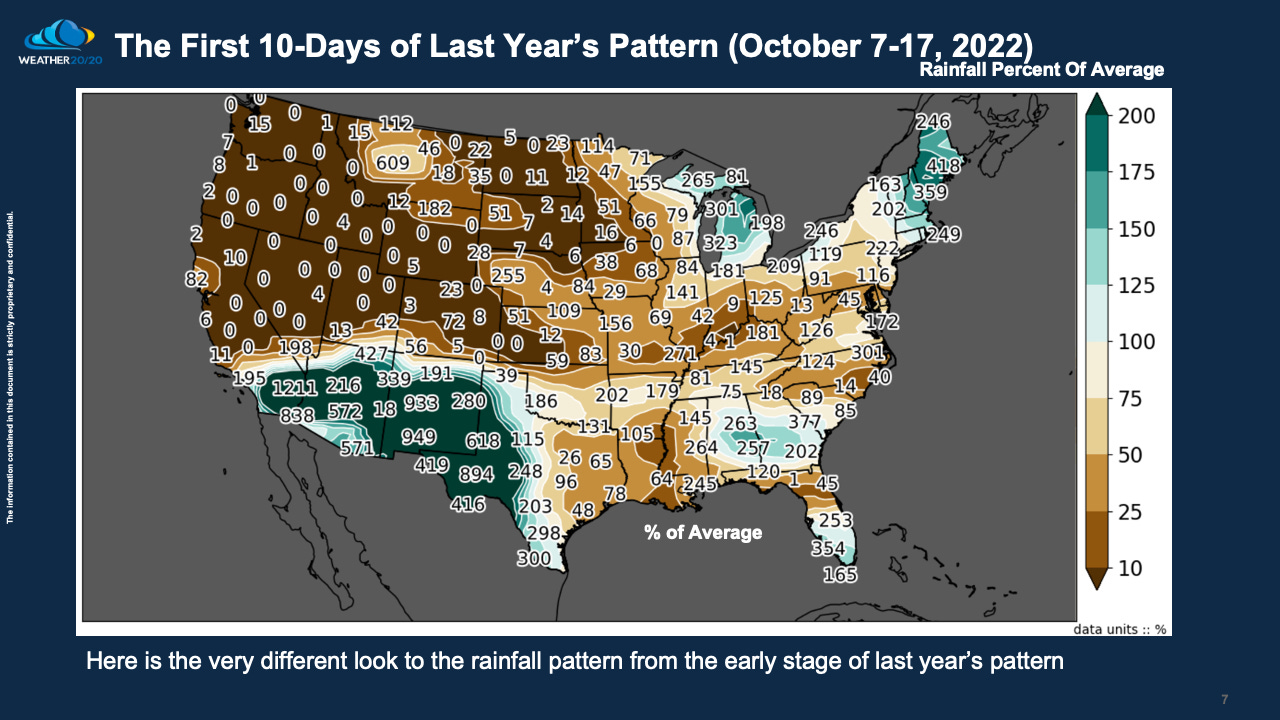
Now, direct your attention to the second map, where you'll notice that the rainfall patterns are dramatically different. This serves as a vivid illustration of the nascent stage of this year's evolving LRC
Clearly, we're observing a striking difference from year to year in a couple of spots. While such differences aren't always this pronounced, the contrast is particularly evident this time around. Looking ahead, a series of storm systems could well be on the horizon, offering the prospect of much-needed precipitation for regions facing drought conditions—specifically in eastern Kansas, western Missouri, and parts of Nebraska and Iowa. We will take a brief look in just a minute.
The Developing El Niño
We will discuss the El Niño influence in the coming weeks.
Let’s Look At The Developing Pattern For The Next 2 Weeks
In the next day, a tropical storm is expected to birth itself off Mexico's west coast. So why should you keep tabs on this? It's highly probable that the system will gain strength, and its moisture will likely become a key player as a sequence of storm systems takes shape out west. Below, you'll find a snapshot from the National Hurricane Center in Miami, highlighting the developing disturbance.
Numerous models are predicting a storm to carve its path into the western region. It bears a striking resemblance to the system we saw take shape around October 12th, as depicted in the maps at the outset of this report. You'll also notice the tropical storm or potential hurricane in the mix. This stormy system is expected to be absorbed, or more aptly 'ejected,' by the developing western disturbance. While hurricanes can be ruinous, it's worth noting their relative size in the grander scheme of the westerly flow and jet stream—essentially a small cog in a much larger atmospheric machine, and it is just going to get “flicked” out.
Some models are painting a wintry picture, forecasting feet of snow over ski destinations, while also projecting inches of rain where it's most needed in the plains. Stay tuned—these evolving conditions will be a key focus in next week's premium version of the Weather 20/20 Intelligence Report.
Exciting things ahead to share soon
As we close this week's Weather 20/20 Intelligence Report, let's talk about what really matters—how this valuable information can make a difference in your life, especially if you're involved in sectors like agriculture, energy, insurance, transportation, shipping, weddings, and more. When you're planning for the planting and harvesting seasons, long-term forecasts are not just a convenience; they're essential. That's what Weather 20/20 is here to provide. Our patent-pending LRC model, which will be updated in just a few weeks, offers a reliable vision of the climatic future, allowing you to make well-informed decisions.
Now, to our premium subscribers, let me extend a hearty thank-you for your continued support. You are the first to get exclusive access to our new LRC model's projections, giving you an unrivaled advantage in weather prediction. But we're not just keeping these insights under lock and key—by becoming a premium member for less than $1 a day, you're investing in the finest long-term weather forecasting service out there. Have a great week. I am planning on a Monday update, Tuesday at the latest.
Gary Lezak


Gary - Thank you for teaching me about the weather -- I appreciate your passion and your explanations. Looking forward to seeing what the new pattern brings us (hopefully rain)