


The Next Chapter of the LRC: Summer's Pattern Is Unfolding
Let's go in-depth and look into these summer signals

Welcome To The Weather 20/20 Intelligence Report!
We’re excited to bring you the next chapter in what continues to be a remarkable year for long-range forecasting. As summer takes hold, the atmosphere is revealing its hand — and once again, the Lezak Recurring Cycle (LRC) is proving that weather is not random chaos, but a well-organized pattern we can decipher.
Today, we’ll walk you through how the evolving summer pattern fits into the larger cycling pattern and what it means for your region and your industry in the weeks ahead. Whether you're planning around agriculture, travel, energy, or events, this is where the science and the art of weather prediction come together.
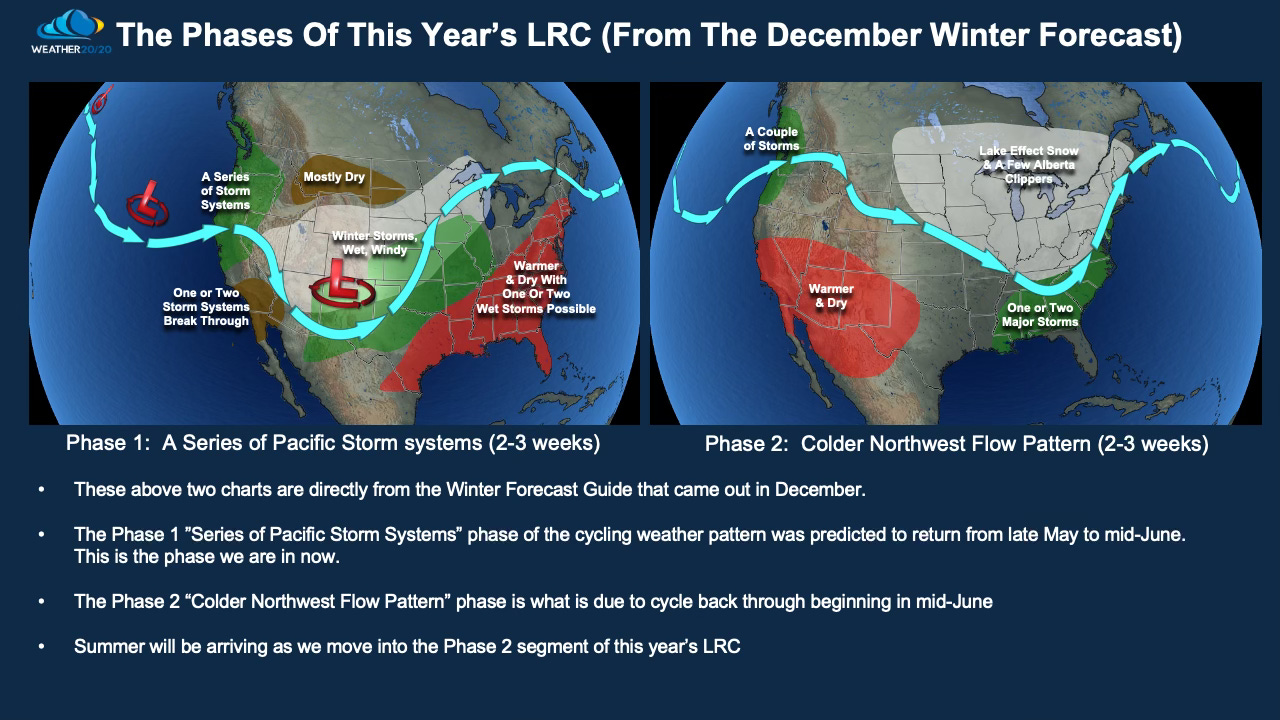
In our Winter Forecast Guide we had already recognized two distinct phases of this year’s LRC. Here are the two graphics showcasing the two phases:
Now, stare at this next slide for a couple minutes:

Over the past few months, we’ve boldly put the spotlight on the Corn Belt — and placed the full weight of the LRC model on the line.
Back in our early spring reports, we forecast that Phase 1 of this year’s unique cycling weather pattern would return in late May and into the first half of June. We emphasized just how critical this return would be — not only to validate the pattern’s consistency, but more importantly, to bring timely rainfall and alleviate deep-rooted drought concerns across key agricultural zones.
And now, right on schedule, the pattern has delivered.
Take a look at the map comparison above. This returning segment of the LRC, the bottom map showing the storm approaching the plains, brought widespread rainfall across several regions that needed it most. This is exactly what we hoped to see, and I it’s tremendous news for soybean and corn producers.
In the next slide, you’ll see the percent of average rainfall across the past 15 days. The data speaks clearly: the majority of the Corn Belt has experienced above-average rainfall during this critical planting and early growth window.

Before we get into the July–August LRC model forecast — which we’re excited to share with you shortly — take a moment to watch today’s video update.
In this video, we’ll walk you through the recent pattern validation, show where the next key signals are developing, and set the stage for what’s ahead this summer. This is where the story gets even more compelling…
Here is today’s video: