


Welcome to spring & thank you for joining Weather 20/20. We have dozens of new customers and we will begin with a discussion of the LRC and the patent-pending model. We will finish with what the latest model is showing for planting, growing, and harvest in this Weather Intelligence Report.
The LRC methodology & technology is the only weather prediction model that is capable of predicting when and where significant weather events will occur. Let’s go in-depth and begin this week’s analysis.

There are two strong storm systems we are tracking this week that have been being monitored that will impact this first week of spring:
Another storm system is moving into California where the drought got wiped away this winter
A late week storm has the potential to produce significant severe weather in the south. We will share with you the risk predicted by Weather 20/20 for this week that is available for our enterprise customers far in advance
It has been cold this March in many areas. What is causing this cold?
The Reason For The Cold - The Arctic Oscillation (AO):

The AO dipped negative in early March. When the AO dips negative, there is an increased probability that cold air, Arctic air, will blast south from Canada. There is a lag coefficient (usually a little delay after it dips negative) from when the Arctic air enters the United States. The AO has trended positive, but the Arctic air got entrained into the lower 48 states and it has been hard to get rid of.
With April approaching, we will finally lose this cold air source, but it is still available for the next few storm systems.


lakajj


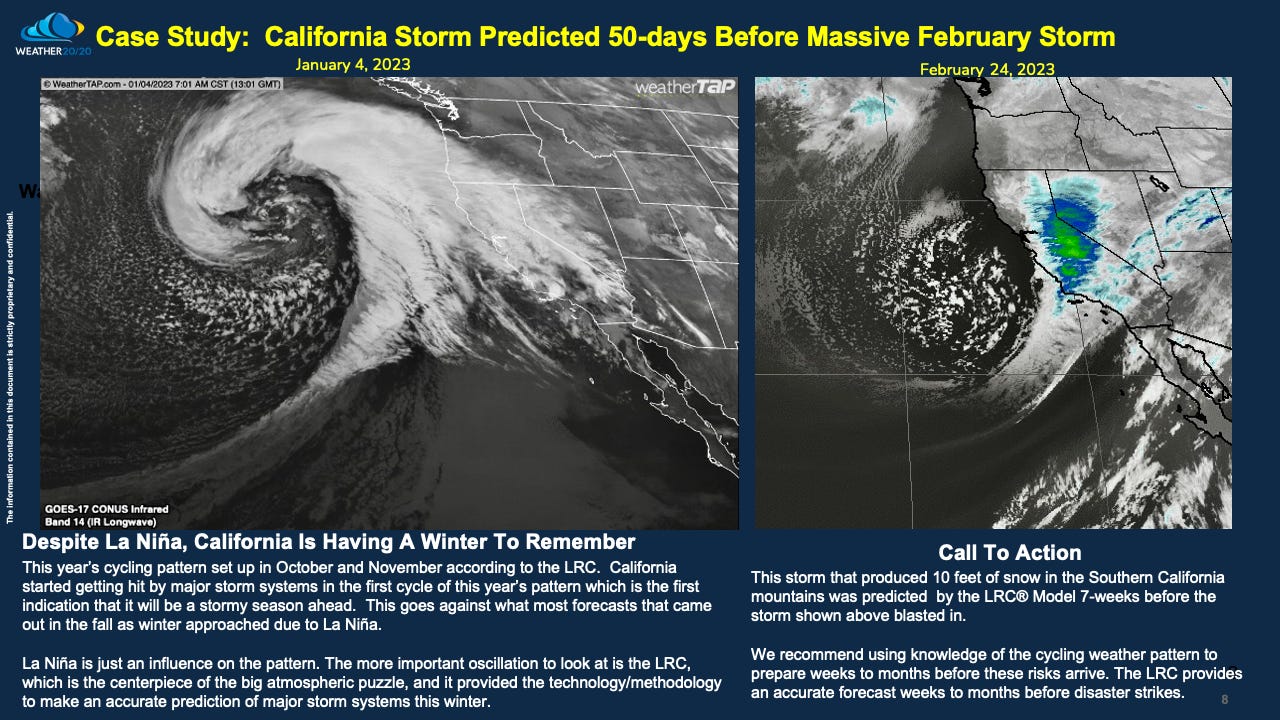
In the peer reviewed published paper on the LRC we discussed how La Niña does not mean it will be dry in California and we presented a great example of the 2015-2016 season that was La Niña and the 2016-2017 season that became an El Niño influenced winter season. In those years, prediction of a dry winter will worsen the California drought came out. And, the very next year with El Niño predictions of a wet winter ahead were made by most sources including the Climate Prediction Center. The exact opposite happened.
Weather 20/20, by using the LRC methodology, accurately predicted the wet winter in 2015-2016, and again this year. Now, next winter with a possible El Niño is undetermined at this time. The new LRC will evolve in the fall and Weather 20/20 will make that forecast after we see the new pattern evolve.
LRC® Model Prediction Made In Early November

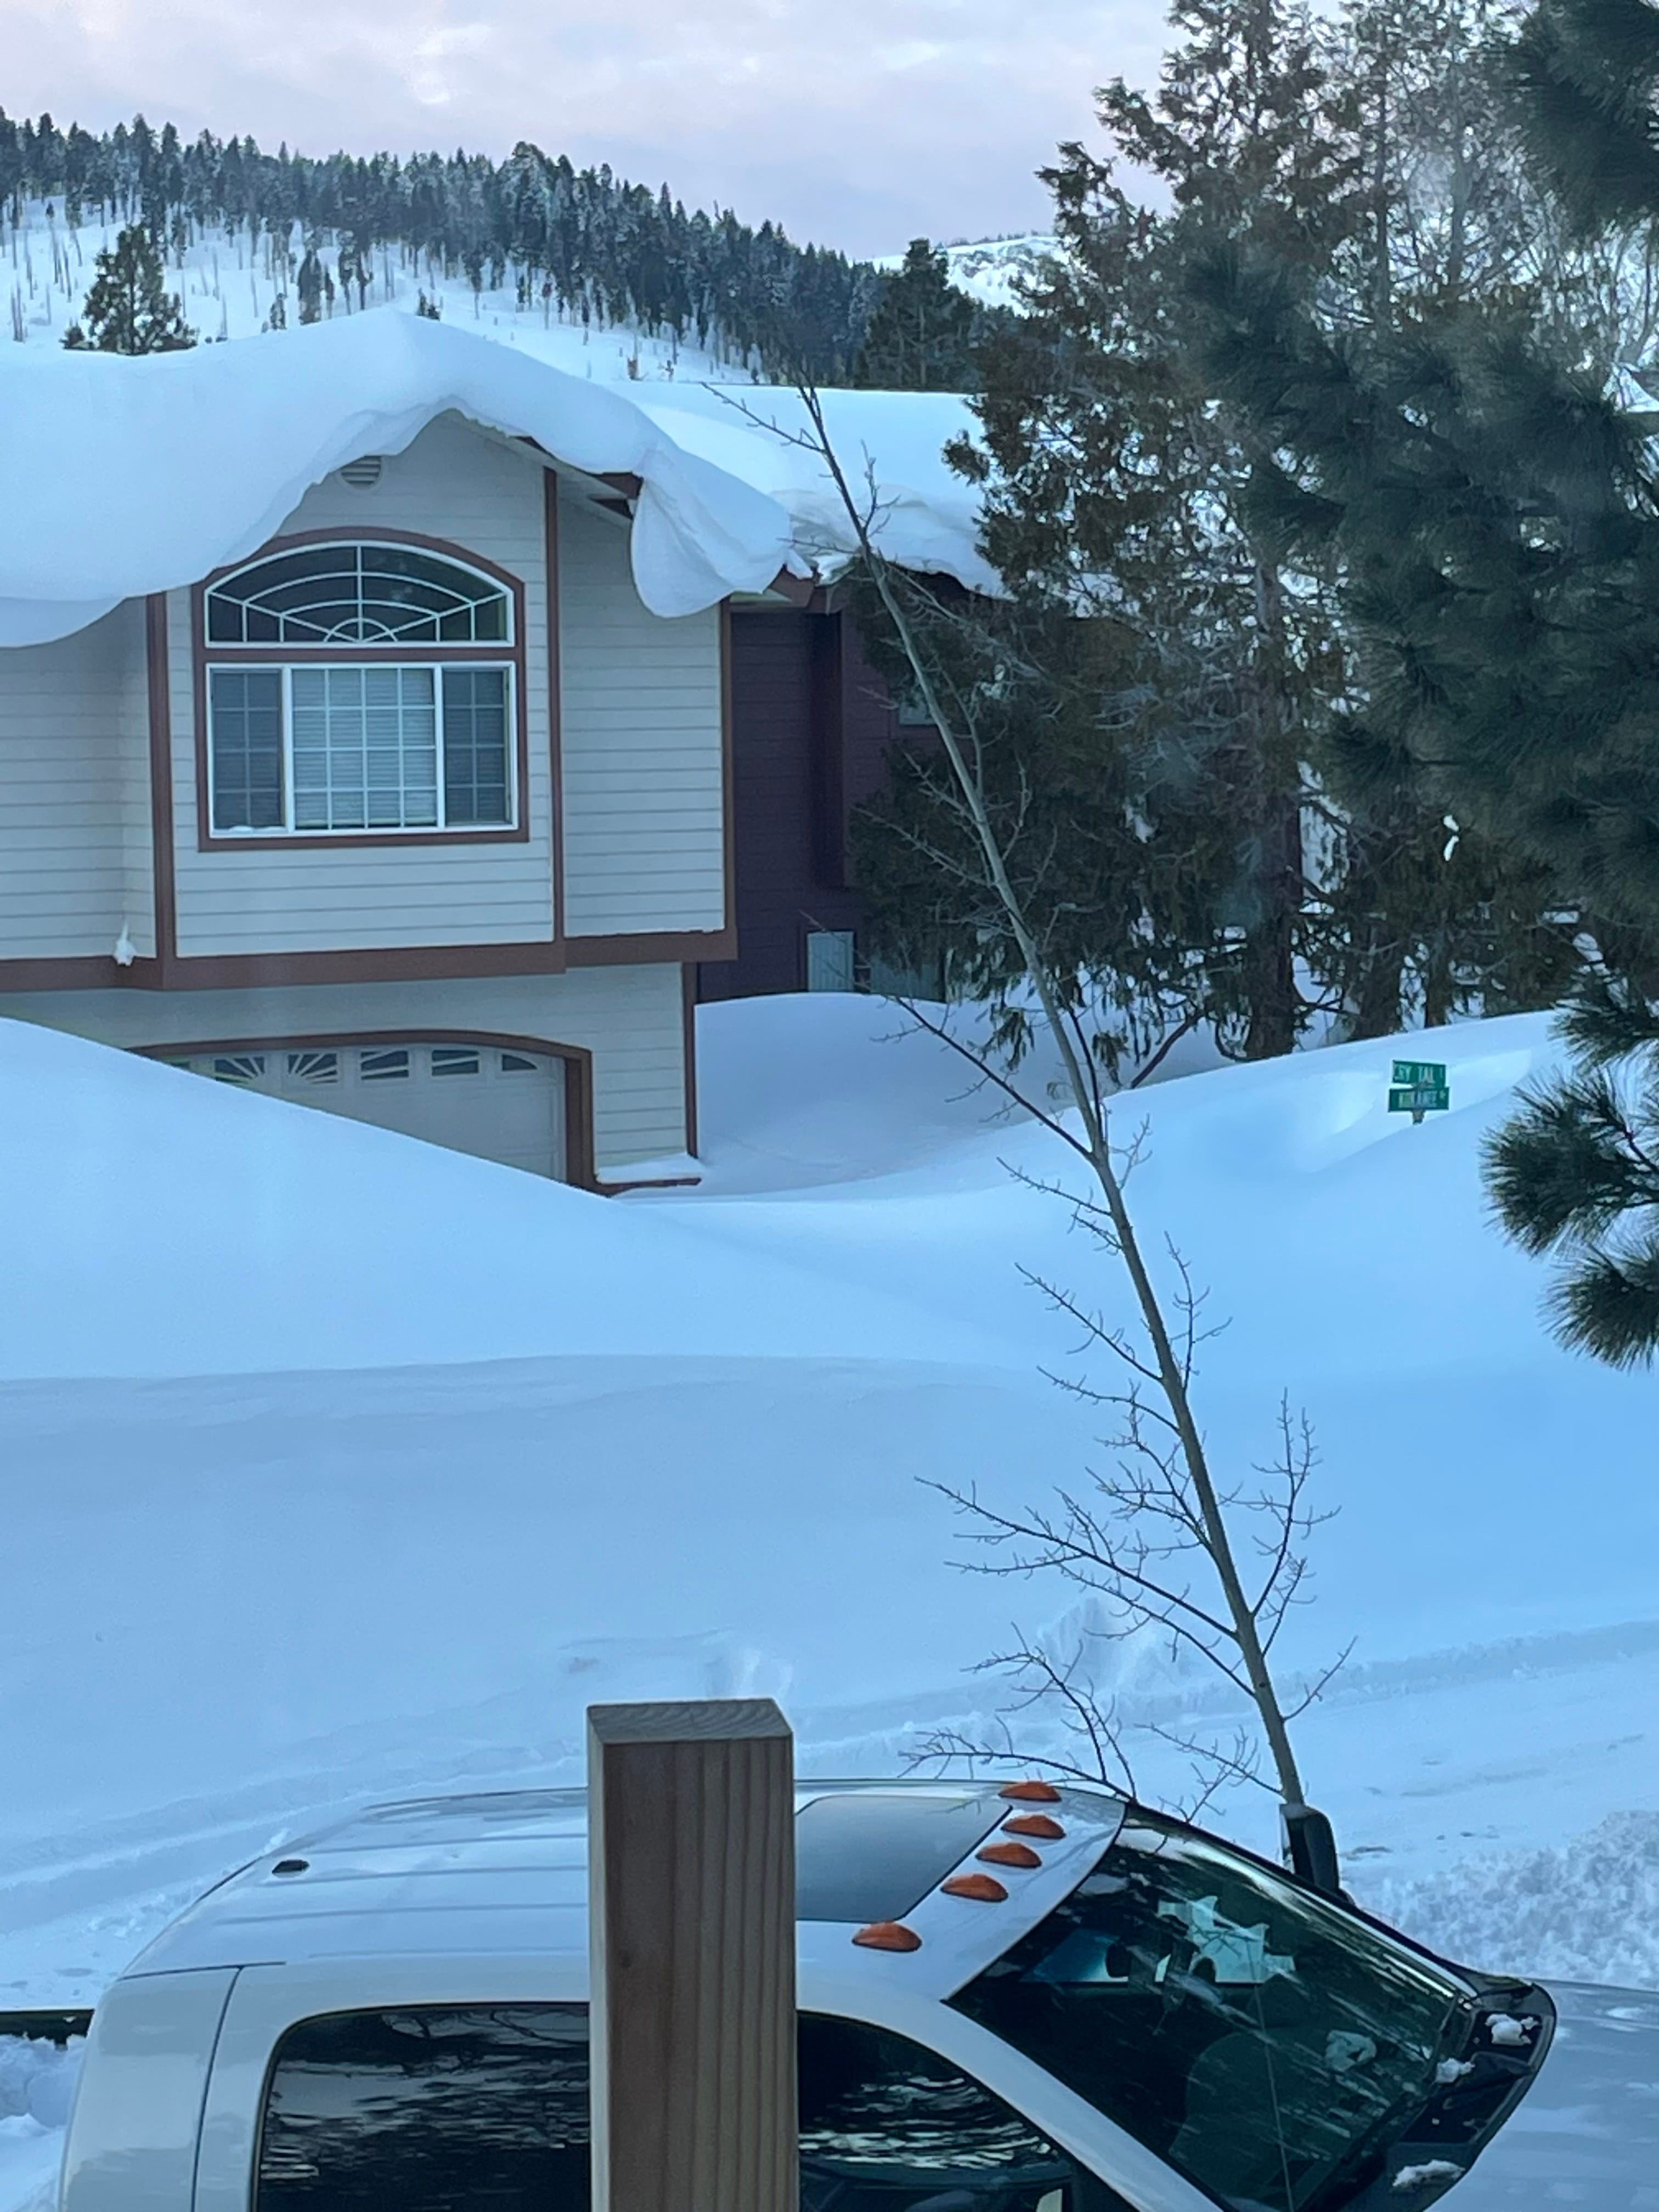
I have a couple of friends that own a house in Tahoe Keys in South Lake Tahoe. I made a video predicting the snowy winter ahead, and this is where I pulled a screenshot from our model, shown above. It shows the Tahoe area with 200% to 400% of average rain and snow, and it has verified.

Severe Weather Risks Predicted:


Severe weather blasted the Dallas Fort Worth metro area on 3/16/2023 and then shifted east and weakened on 3/17/2023:

This accurate prediction was made 60-days before. Now, was it perfect? No, it wasn’t, but compare it to the day 1 risks from the SPC. The 60-day outlook predicted this two months before.
This Week’s Forecast From Over 60-Days Ago

The pattern is cycling and right on schedule. The part of the pattern creating this weeks storm is also right on schedule. In between storm systems the severe weather is usually quiet with no severe weather reports, especially at this time of the year. We have predicted the larger outbreaks and many of the smaller ones in the past decade.
Did you read The Daily Beast Article last week? Near the end of the article, written beautifully by Maddie Bender, “He’s not surprised that scientists doubt his work, though, adding he knows that the LRC “makes other scientists a little nervous.” As is in weather prediction—and in life for that matter—only time will tell how the LRC will fare. If Lezak is right, the model could be the biggest development in meteorology since chaos theory. If he’s wrong, though, it’ll be a disaster you can’t blame on nature.
For those of you following the LRC for the past 20+ years, we know it won’t be a disaster that you can’t blame on nature! We are going to help save lives and help businesses like your company generate revenue and mitigate loss.
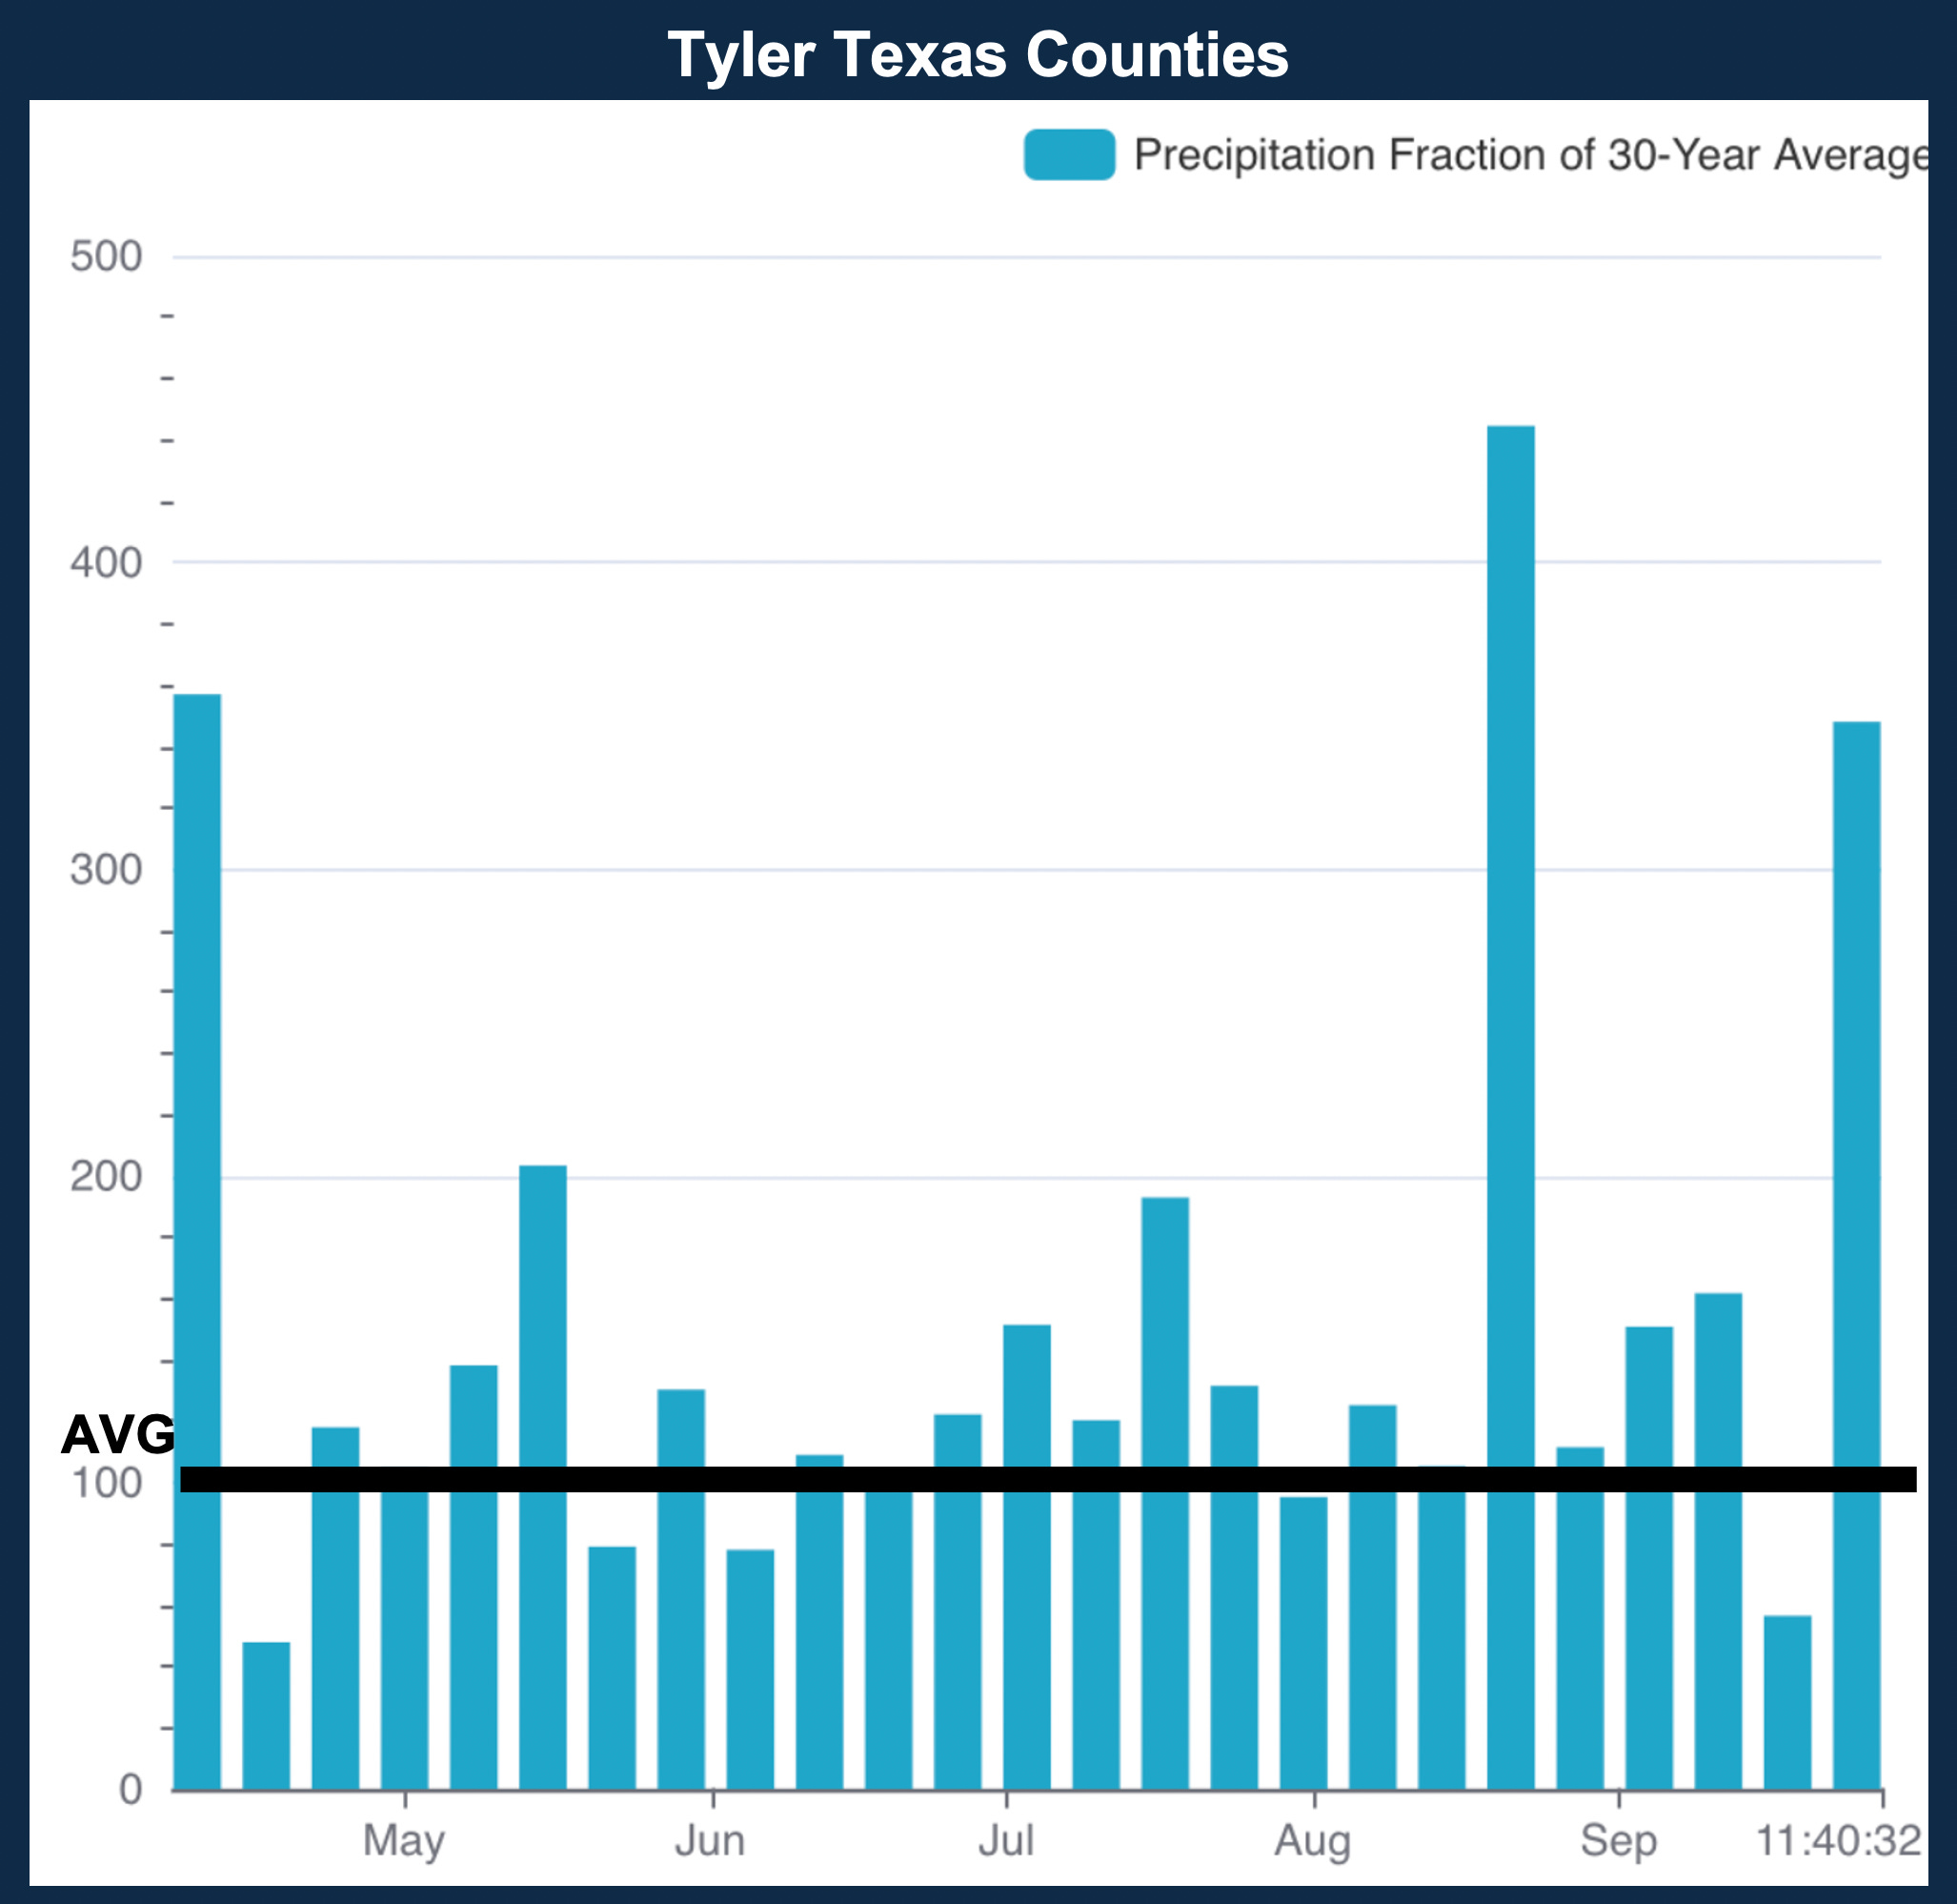
LRC Model Predictions For Through September
Please do not underestimate how this weather prediction information can be leveraged by your team. If you want more detail, there are other levels of products available from Weather 20/20. These model predictions get specific and are accurate week-by-week, and even down to day-by-day at 100 days out.


Here is one of the requests for Tyler, TX: Forecast for April 15, 2023 to Sept. 30, 2023


Richland & Sargent counties in North Dakota


Sheridan, McClean, & McHenry Counties in North Dakota


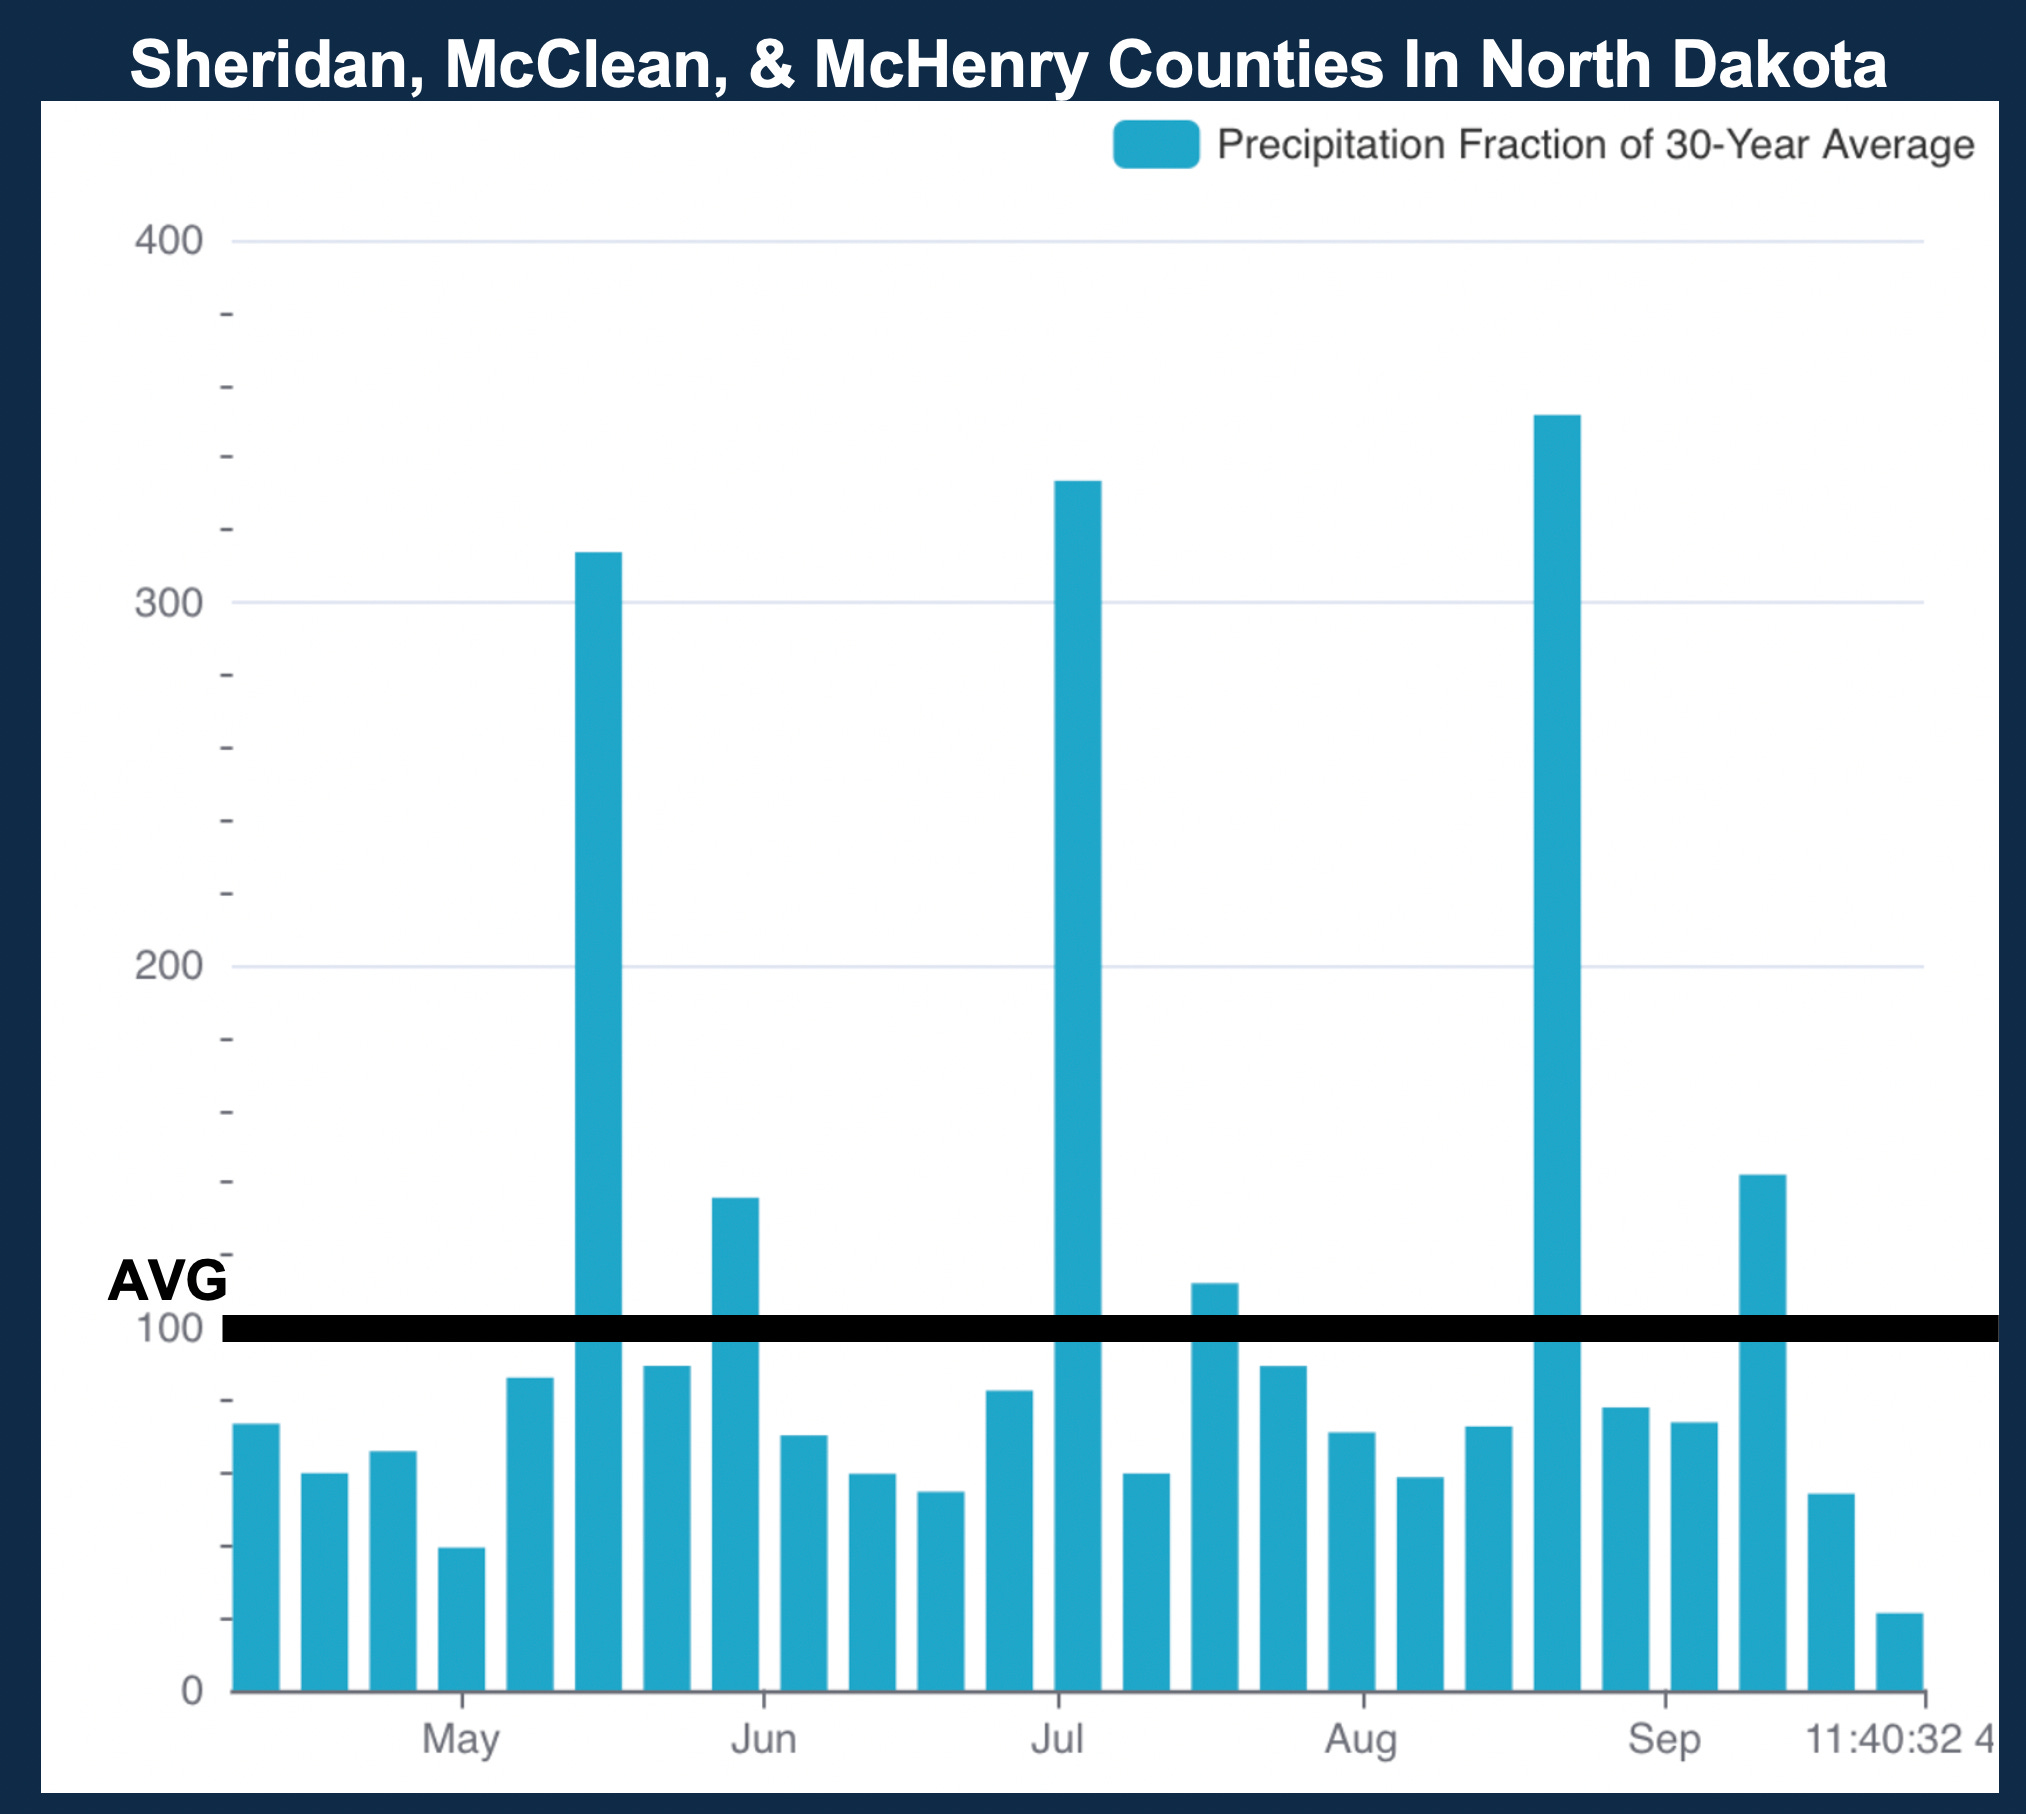


The model predictions will only slightly shift or change, or possibly barely change at all. There is a bit lower confidence on the precipitation patterns after around the second week of July. We will continue to work on improving the model, and don’t underestimate that this model is global and the only known methodology and technology that predicts where and when significant weather will have an impact.
Thank you again, and let us know if you have any questions. Our next update will be early next week.
Have a great start to spring!
Gary Lezak

Share this post